70
10.5
10.4
67.4
65
10.0
64.4
9.7
9.6
61.0
9.5
60
9.0
55
5
20
30
5
20
30
Mortar Temperature (C)
Mortar Temperature (C)
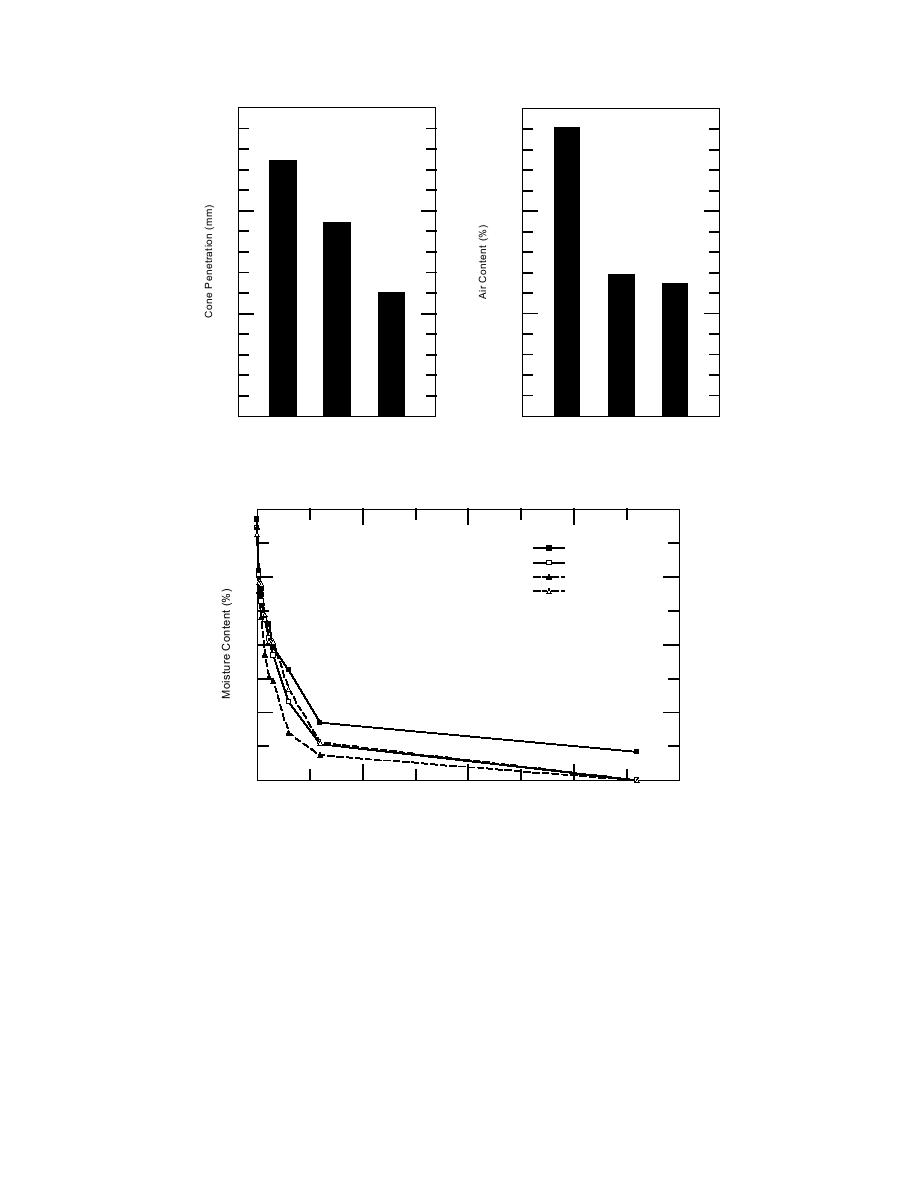
a. Initial cone penetrations
b. Air contents.
Figure 9. Effect of mortar temperature.
16
Concrete Brick
CMU A
CMU B
12
CMU C
8
4
0
0
400
800
1200
1600
Time After Mortar Placed on Brick (min)
Figure 10. Effect of unit manufacture on rate of mortar moisture loss. Unit
and mortar (MC-M) temperatures are 20C.
Comparison of water absorption test methods
formed, the following conclusions about the mor-
While there does not appear to be a good rela-
tar moisture loss tests could have been accurately
tionship between the results of the full immersion
estimated:
absorption test and the results of either of the two
The relative relationship between the rate of
other absorption test methods performed, there
mortar moisture loss to the different units
does appear to be a rather promising relationship
evaluated
between the results of the partial immersion tests
The relative relationship between the effect of
and the mortar moisture loss tests. These results
unit moisture content on mortar moisture
could support the use of the partial immersion
loss
tests to predict the effects of concrete masonry
units on the rate of moisture loss by a masonry
The lack of significant influence of mortar
mortar. For the partial immersion tests per-
temperature on mortar moisture loss.
11


 Previous Page
