Table 5. Criterion for determin-
ing frost-susceptibility of soils.
Frost heave
Frost-
of soil (in.)*
susceptibility
≤ 0.5
Non-frost-susceptible
0.5 to 0.7
Marginal
≥ 0.7
Very
* 1 in. = 25.4 mm.
Table 6. Frost-susceptibility as a function of the
Plasticity Index (PI).
FAA
Material and
Relative frost-
designation
layer type
PI
susceptibility
P-154
Subbase course
6
medium
P-208
Aggregate base course
6
medium
P-209
Crushed aggregate base course
4
low
P-211
Lime rock base course
6
medium
P-213
Sandclay base course
4
low
6
medium
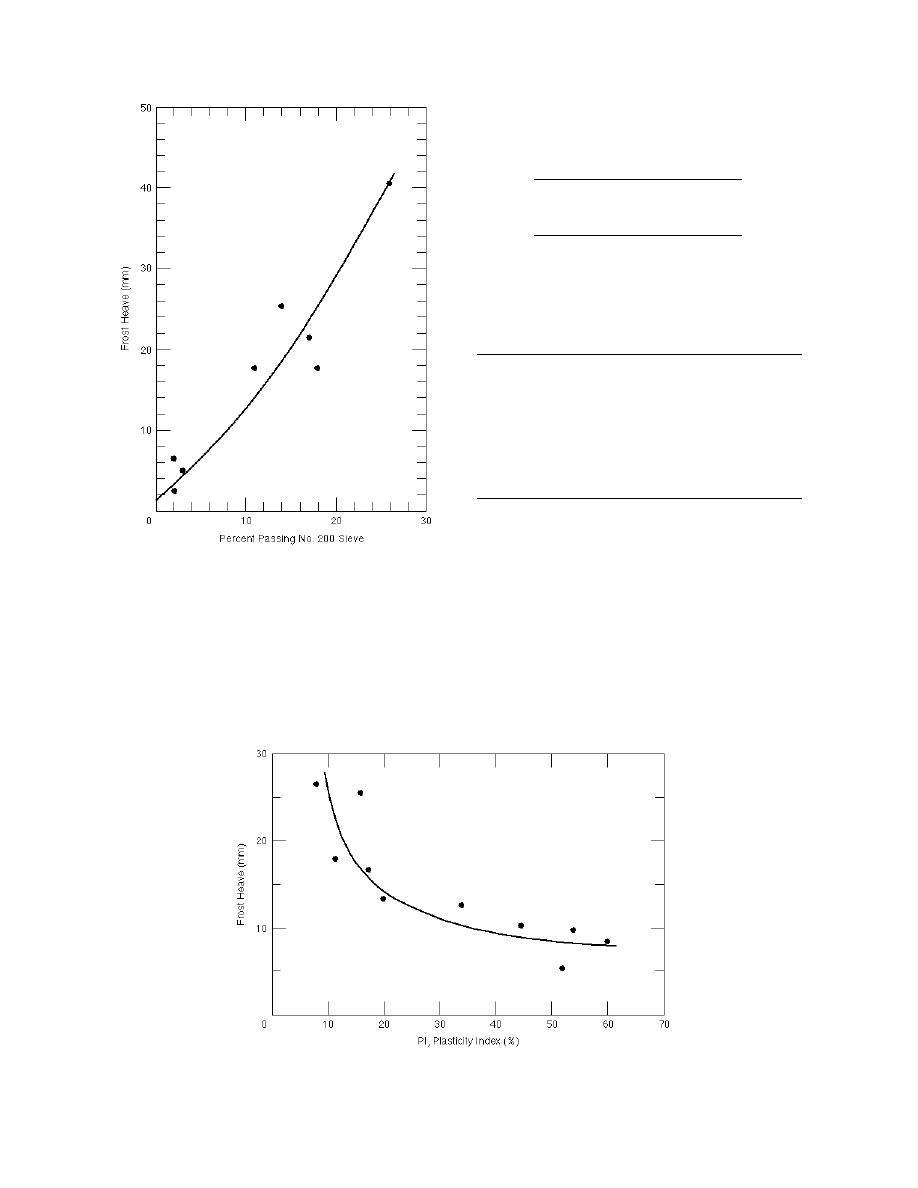
sults of Kaplar (1974) for coarse-grained gravelly
base course materials (GW, GP, GW-GM, GP-GM,
GM, GW-GC, GP-GC, GM-GC, GC) and found an
Figure 3. Relationship between frost heave and per-
increasing trend between PI, up to 7%, and aver-
centage passing the no. 200 sieve--noncohesive soils
age rate of heave (Fig. 5). The rate of heave de-
other than limestone gravels (1 in. = 25.4 mm).
creased at PI levels greater than 8%, which agreed
with the results of Croney and Jacobs (1967).
(Fig. 4). They reported that as the PI increased,
Table 6 shows the PI limits in the FAA specifica-
the amount of frost heave decreased. Since the
FAA specifications limit the PI of the subsurface
tions and the relative frost-susceptibility deter-
materials used in airport construction, the PI
mined from Figure 5. The materials in Table 6
could be used as an indicator of frost heave.
were classified as having either low or medium
We reviewed of some of the laboratory test re-
frost-susceptibility. It should be noted that the PI
Figure 4. Relationship between frost heave and PI for cohesive soils (1 in. =
25.4 mm).
9


 Previous Page
