80
NO
60
3
40
NO
2
20
Nitrite-2
Nitrate-2
0
30
40
50
60
70
80
90
20
Moles 2-ADNT Consumed
a. 2-ADNT.
NO
2
60
NO
3
NO
50
3
40
NO
2
30
20
Nitrite-4
10
Nitrate-4
2-ADNT
0
0
20
5
10
15
40
50
60
70
80
90
Moles 4-ADNT Consumed
Time (min)
b. 4-ADNT.
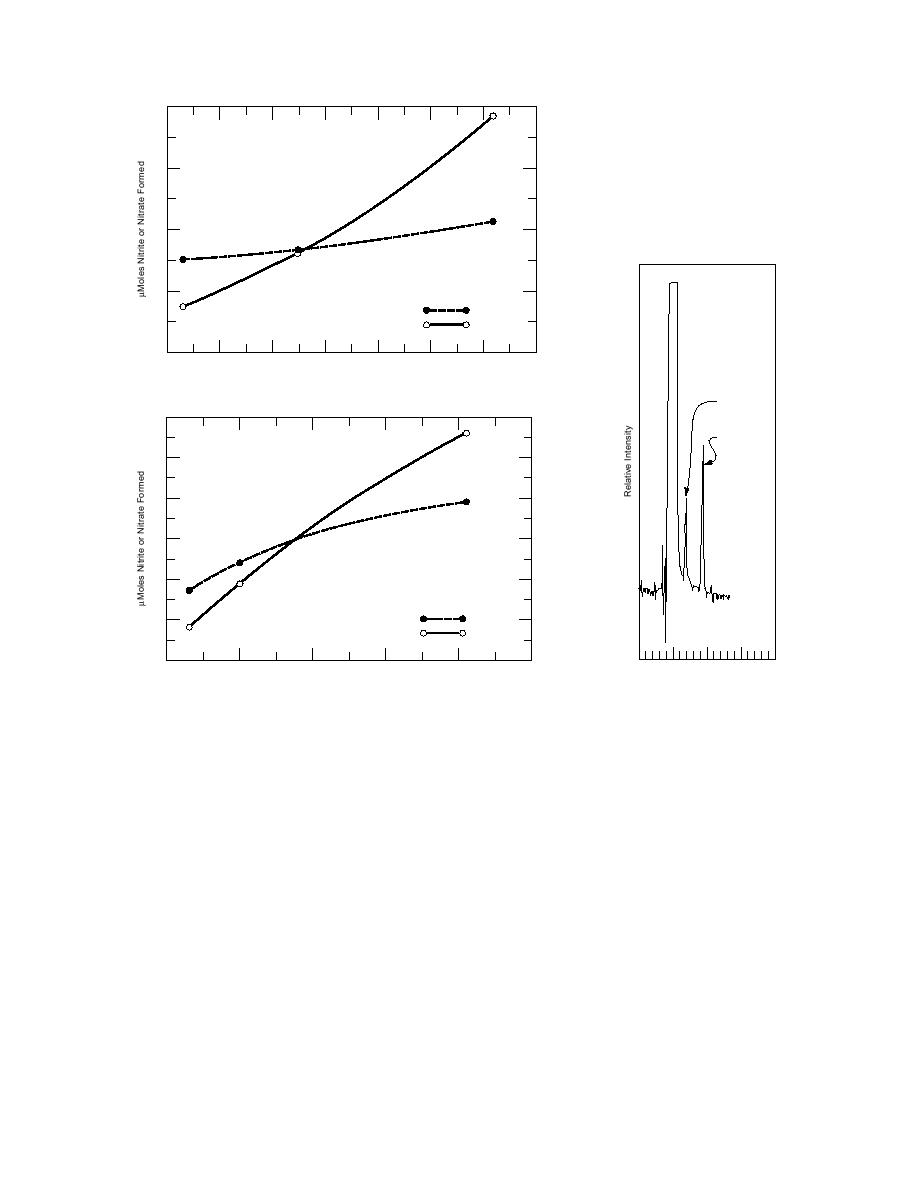
Figure 12. Plots of nitrite and nitrate formation as a function of
Figure 13. HPLC profile of
2-ADNT and 4-ADNT loss.
nitrite and nitrate forma-
tion in 2-ADNT oxidation
by ozone.
1.6 109 M1 s1 and 1.9 109 M1 s1, respectively, when p-nitroacetophenone was used as a refer-
ence chemical. If we assume an ozone concentration of 1 104 M (4.8 mg/L), we can estimate the
hydroxyl radical concentration necessary to make the hydroxyl radical rate (RHO) competitive
with ozone (RO ) by using eq 5 and 2-ADNT as an example:
3
RO /RHO = kO (O3)/kHO[OH]
(5)
3
3
= 5.3 105 M1s1 (1 10-4 M) / 1.6 109 M1s1 [HO]
= 3.3 108 M/[HO]
If RO /RHO = 1, then [HO] = 3.3 108 M.
3
Because hydroxyl radical concentration is usually in the 1011 to 1014 M range, this oxidative path-
way cannot compete with ozone for ADNTs in pure water systems. However, when ADNT concen-
trations become extremely low (ppb range), the reaction of ozone with hydrogen peroxide will
dominate the loss of ozone (compared to the reaction with ADNT) and lead to an increase in the
loss of ADNT by the hydroxyl radical pathway.
10


 Previous Page
