1.0
0.8
0.6
0.4
5
10 ft
1 0 ft
0.2
500 ft
00 ft
0
100
200
300
400
Time (h)
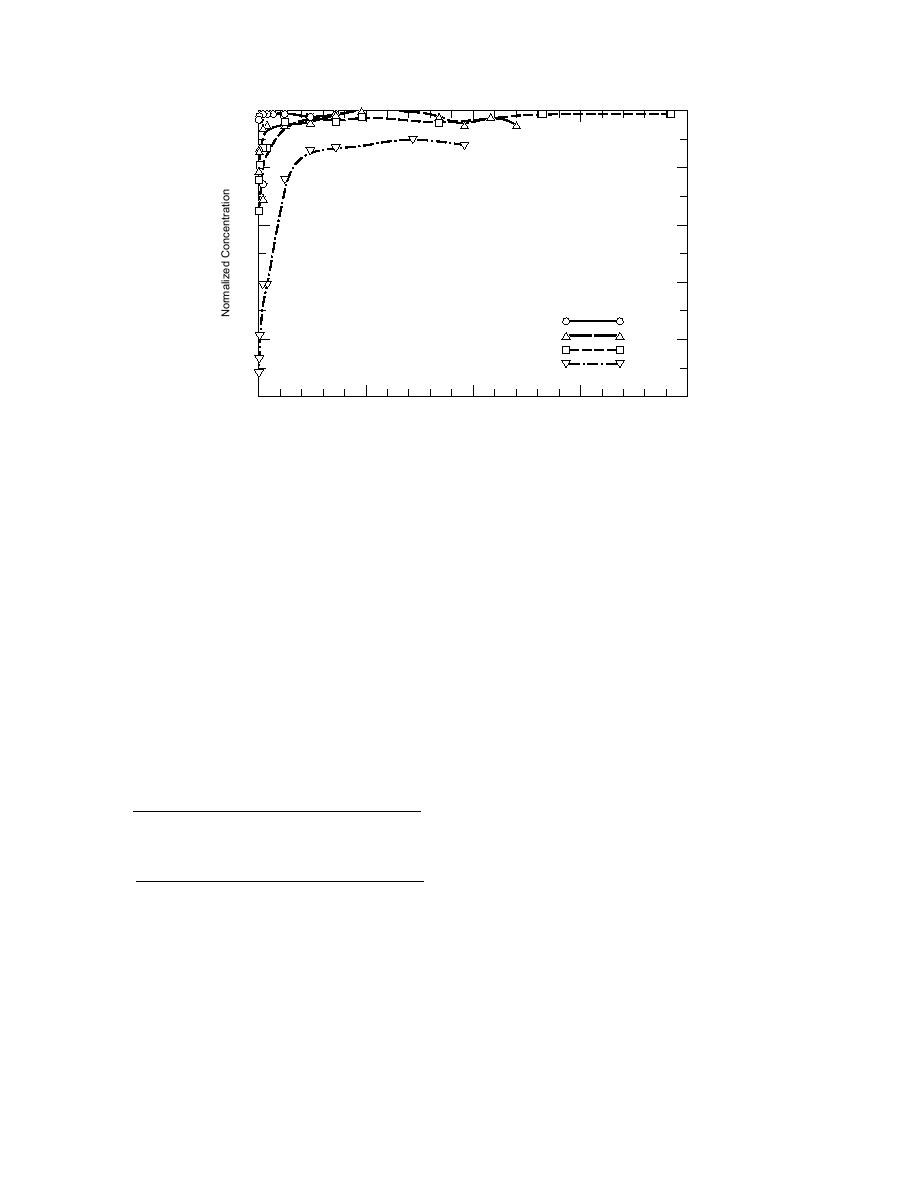
Figure 8. Comparison of losses of TCE by different lengths of LDPE tubing.
min. (Appendix Table A2 gives the mean normal-
effect a faster flow rate had on sorption. Because
ized concentrations of TCE, and Appendix Table
of physical limitations we had with the delivery
B2 gives the concentrations of TCE [in mg/L] in
system, only three tubings could be used in this
the water before and after pumping it through
study. We selected PP1, LDPE, and PVDF. We
the tubing.) For this length of tubing, sorption
eliminated PP 2 because its performance was
was much more pronounced initially, with 92%
very similar to PP1 and P(VDF-HFP) because its
loss after 10 min. Equilibration appears to occur
performance was very similar to PVDF.
after 48 hr of pumping, with residual losses of
Figure 9 shows the relative concentrations of
1015%. For comparison, Figure 8 also shows
TCE in water that was pumped through 100-ft
losses of TCE from water pumped through the
sections of these tubings at a flow rate of 1 L/
100-ft, 50-ft, and 10-ft lengths. The relationship
min. (Appendix Table A3 gives the mean normal-
ized concentrations and Appendix Table B3 gives
the initial and final concentrations [in mg/L] and
Table 4. Relationship between the pumping
time (t) and the relative concentration (Ct)
the results of the statistical analyses.) Statistical
of TCE in water pumped through various
analyses indicated that the concentrations of TCE
lengths of LDPE tubing at 100 mL/min.
in samples pumped through the PP1 tubing were
significantly lower than the controls. However,
Contact
these losses were always less than 10%. In gener-
Length
time
r†
(ft)
(min)*
Relationship
al, concentrations of TCE in water pumped
through the PVDF and LDPE tubings did not dif-
10
1
Ct = 0.978 + 0.0067 log(t)
0.709
fer significantly from the controls.
50
5
Ct = 0.873 + 0.0495 log(t)
0.890
Figures 10a and 10b compare sorption of TCE
100
10
Ct = 0.785 + 0.0932 log(t)
0.954
500
50
Ct = 0.244 + 0.309 log(t)
0.975
in water pumped through 100 ft of LDPE and PP1
tubing, respectively, at the two flow rates (1 L/
* Time for water to pass through tubing.
† Correlation coefficient.
min and 100 mL/min). The relationship between
the pumping time and the relative concentration
between the pumping time (t) and the relative
of TCE for each of the two tubings and flow rates
concentration (Ct) for the various lengths of tub-
is given in Table 5. We see a similar trend to the
ings is given in Table 4. It is clear that for the
one we observed with the longer lengths of tub-
longer tubings or contact times, sorptive losses
ing, namely that at the slower flow rate (or long-
can be adequately described by a log function.
er contact time) sorption can be adequately de-
scribed by a log function. There is good agree-
Sorption findings for the third study
ment between the expression for the relative con-
In this study, we wanted to determine what
centration of TCE in water pumped through 100
10


 Previous Page
