1.0
0.8
0.6
0.4
PVDF
PE
PP2
0.2
PP1
(VDF-HFP)
0
100
200
300
400
Time (h)
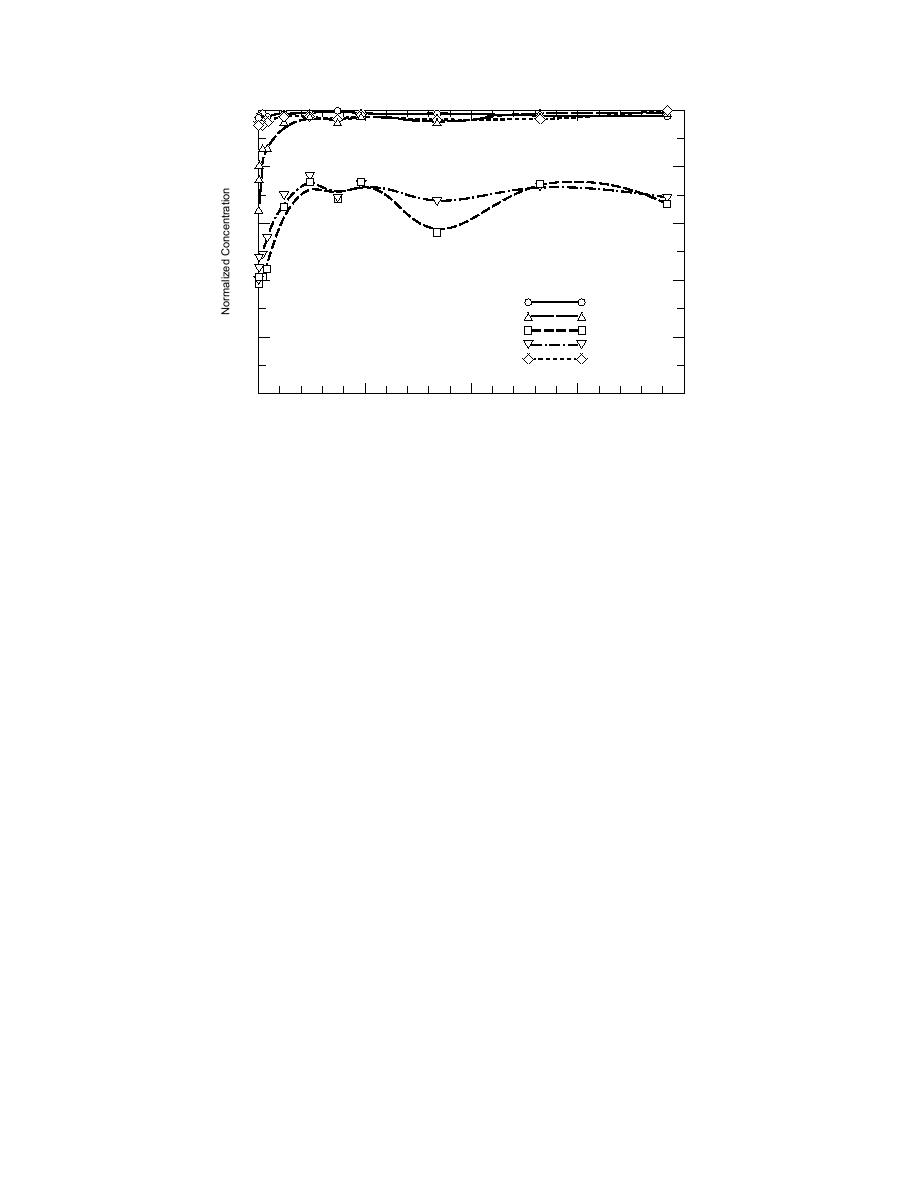
Figure 7. Normalized concentration of TCE in water pumped through 100 ft of
tubing at 100 mL/min.
centration of TCE in well water that was pumped
materials, both initially and at equilibrium. For
through 10-ft, 50-ft, and 100-ft lengths of PVDF,
example, after ten minutes' contact, ~60% of the
P(VDF-HFP), PP1, PP2, and LDPE tubings at a
TCE was sorbed by the 100-ft sections of these
flow rate of 100 mL/min. (Appendix Table A1
tubings. However, losses were still substantial at
gives the mean normalized concentrations, and
equilibrium with losses of 1020% for the 50-ft
Appendix Table B1 gives the actual concentra-
sections and 30% for the 100-ft sections. We are
tions of TCE [in mg/L] in the well water before
not certain what accounts for the pronounced
and after pumping it through the various tub-
dip in the curves around 150200 hr for the 50-ft
ings. Appendix Table B1 also shows the results of
length of PP1 or 100-ft length of PP2. It may be
the statistical analyses.) The two fluoropolymers,
due to breakthrough of the TCE through the tub-
PVDF and P(VDF-HFP), were clearly the least
ing walls to the atmosphere.
sorptive tubings tested. Sorption of TCE by these
These results agree well with the results from
two fluoropolymers was always 5% or less, even
our static study (Parker and Ranney 1996). That
for the 100-ft sections. For the other polymers,
is, among the tubings tested in this study, the
sorption was minimal (< 10%) for the 10-ft sec-
plasticized PP tubings sorbed the most TCE and
tions of tubing but became substantial when
the fluoropolymers were the least sorptive.
longer tubings (50 ft and 100 ft) were used. Loss-
Based on these findings, it appears that LDPE
es were greatest initially but then approached
could be used to sample TCE if there is an ade-
some type of equilibrium value.
quate equilibration period. This does not appear
For LDPE, initial losses of TCE were 20% for
to be true for the plasticized polypropylene tub-
the 50-ft and 35% for the 100-ft lengths. However,
ings. Because there would be a substantial cost
these losses were reduced to ~5% after 4 hr of
savings if LDPE tubing could be used, the next
pumping for the 50-ft lengths and after 24 hr for
experiment was designed to see how much TCE
the 100-ft lengths. It appears that the tubing and
would be lost with a much longer length of LDPE
TCE-contaminated water reached equilibrium at
tubing (500 ft) and when equilibration might be
these times. The large losses observed initially
expected. A five-hundred-foot well would be one
were most likely due to adsorption on the poly-
of the deeper wells one might sample, but cer-
mer surface. The residual losses that were found
tainly not the deepest.
at equilibrium most likely resulted from diffu-
sion through the polymer matrix.
Sorption findings for the second study
The pattern of losses was similar for the two
Figure 8 shows the mean relative concentra-
plasticized polypropylene tubings (PP1, PP2).
tion of TCE in water that was pumped through
However, losses were much greater for these
500 ft of LDPE tubing at a flow rate of 100 mL/
9


 Previous Page
