of a sample exposed to a tubing for a given sam-
tration (mg/L) after passing through the tubing
pling time and dividing it by the mean concen-
from the control concentration (mg/L), 2) plot-
tration for the control samples for the same time.
ting the difference (mg/L) vs. time, 3) taking the
Thus a mean normalized value of 1.00 represents
sum of the areas under the lines drawn from time
no loss of TCE for a given tubing and time.
1 to time 2, time 2 to time 3, etc., and then 4) mul-
The total amount desorbed (mg) from each
tiplying the total area by the flow rate.
tubing was determined by 1) plotting the con-
centration desorbed vs. time, 2) taking the sum of
RESULTS AND DISCUSSION
the areas under lines drawn from time 1 to time
2, time 2 to time 3, etc., and 3) multiplying the
Sorption/leaching studies
total area by the flow rate.
The total amount sorbed (mg) by the PP1 tub-
Sorption findings for the first study
ing was determined by 1) subtracting the concen-
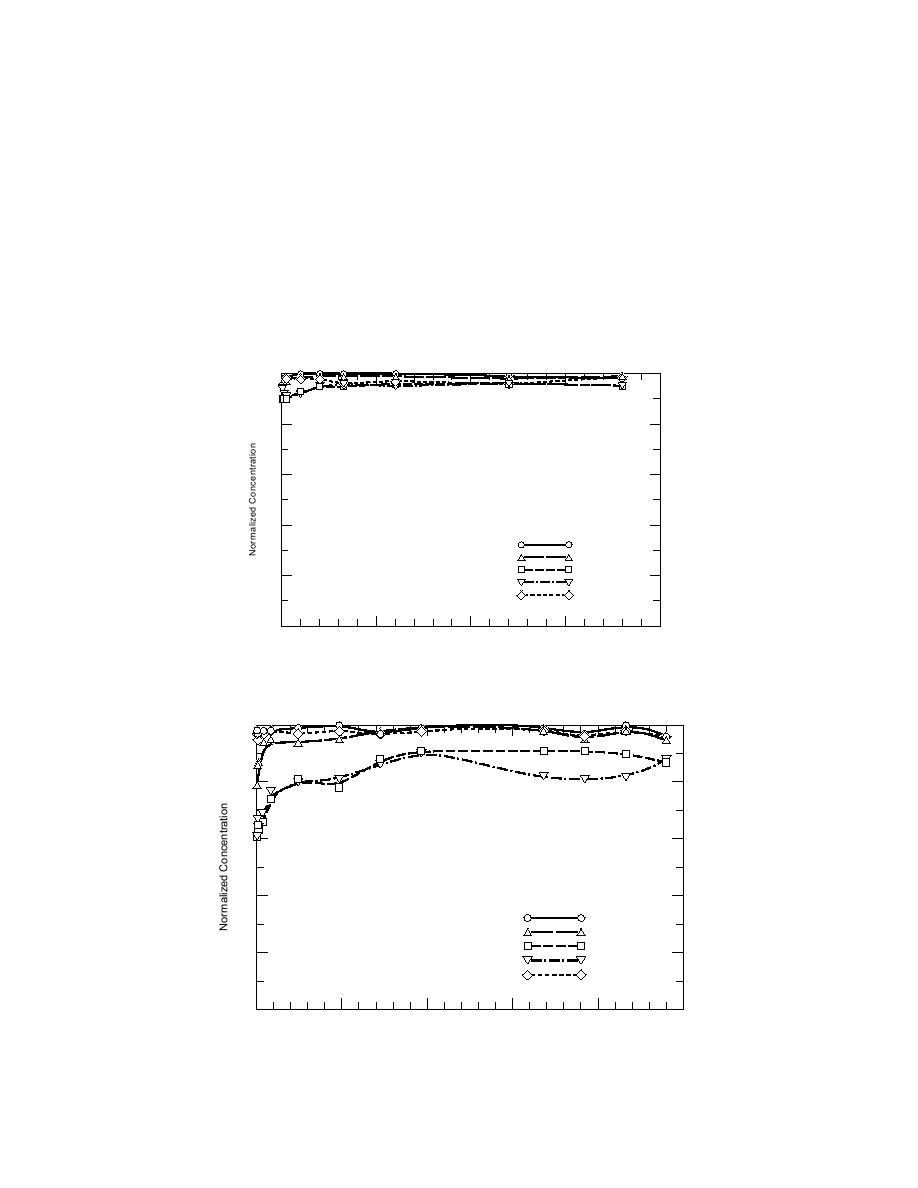
Figures 5, 6, and 7 show the normalized con-
1.0
0.8
0.6
0.4
PVDF
PE
PP2
0.2
PP1
(VDF-HFP)
0
20
40
60
80
Time (h)
Figure 5. Normalized concentration of TCE in water pumped through
10 ft of tubing at 100 mL/min.
1.0
0.8
0.6
0.4
PVDF
PE
PP2
0.2
PP1
(VDF-HFP)
0
50
100
150
200
250
Time (h)
Figure 6. Normalized concentration of TCE in water pumped through 50 ft of
tubing at 100 mL/min.
8


 Previous Page
