20
10
FE Outside (5 ft)
Upp Imm (9.82 ft)
Actual Outside (5 ft)
Mid Imm (5.26 ft)
16
8
Low Imm (4.76 ft)
FE Inside (5 ft)
Ground (4.81 ft)
Actual Inside (5 ft)
Control (5 ft)
12
6
8
4
4
2
0
0
3 Sep
13 Oct
22 Nov
1 Jan
10 Feb
22 Mar
2 Nov 22 Nov 12 Dec
1 Jan
21 Jan
10 Feb
2 Mar 22 Mar
1994
1995
1994
1995
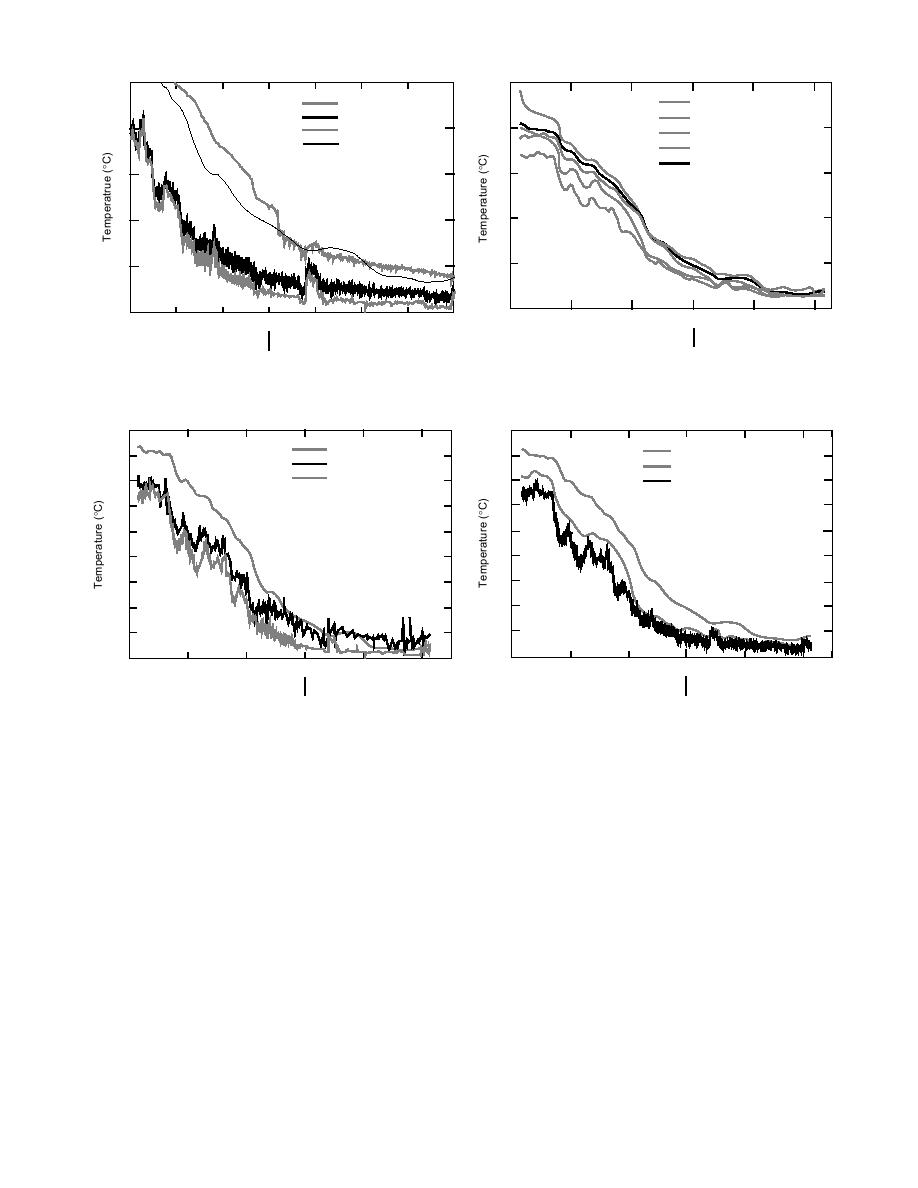
Figure 19. Inside vs. outside shield temperatures.
Figure 17. Immersion temperature vs. ground temperature.
18
18
Ground (4.00 ft)
Ground (5 ft)
16
16
Underdrain (4.07 ft)
FE Pipe Temperature
Low Imm (4.76 ft)
14
14
Actual Water Temperature
12
12
10
10
8
8
6
6
4
4
2
2
0
0
3 Sep
13 Oct
22 Nov
1 Jan
10 Feb
22 Mar
3 Sep
13 Oct
22 Nov
1 Jan
10 Feb
22 Mar
1994
1995
1994
1995
Figure 18. Comparison of lower immersion thermocouple,
Figure 20. Pipe vs. ground temperature.
underdrain, and earth temperatures.
NUMERICAL MODEL
19), it is evident that the inside temperature is
ASSESSMENT
colder than the adjacent outside temperature. This
is a result of the cold water temperatures in the
The first shield was designed using air tem-
shield and the fact that it was a warm year. In a
peratures that we hoped would be representative
normal year we would expect the inside shield
of an extremely cold year. This was a conserva-
temperature eventually to become warmer than
tive approach both from the climatological stand-
the outside when the colder temperatures pen-
point as well as the numerical modeling stand-
etrate deeper into the ground as the year pro-
point because the numerical model uses surface
gresses. Figure 19 also shows the control tem-
temperature, which is usually warmer than air
peratures, which are in ledge, becoming colder
temperature. Figure 21 shows the actual surface
than the equivalent depth at the pipe, which is in
temperature from our control string on Labossiere
sand backfill. It is evident in Figure 20 that the
and two regression lines. One regression repre-
ground temperature at the depth of the shield did
sents the FE boundary temperature used in our
not get colder than the water temperatures.
13


 Previous Page
