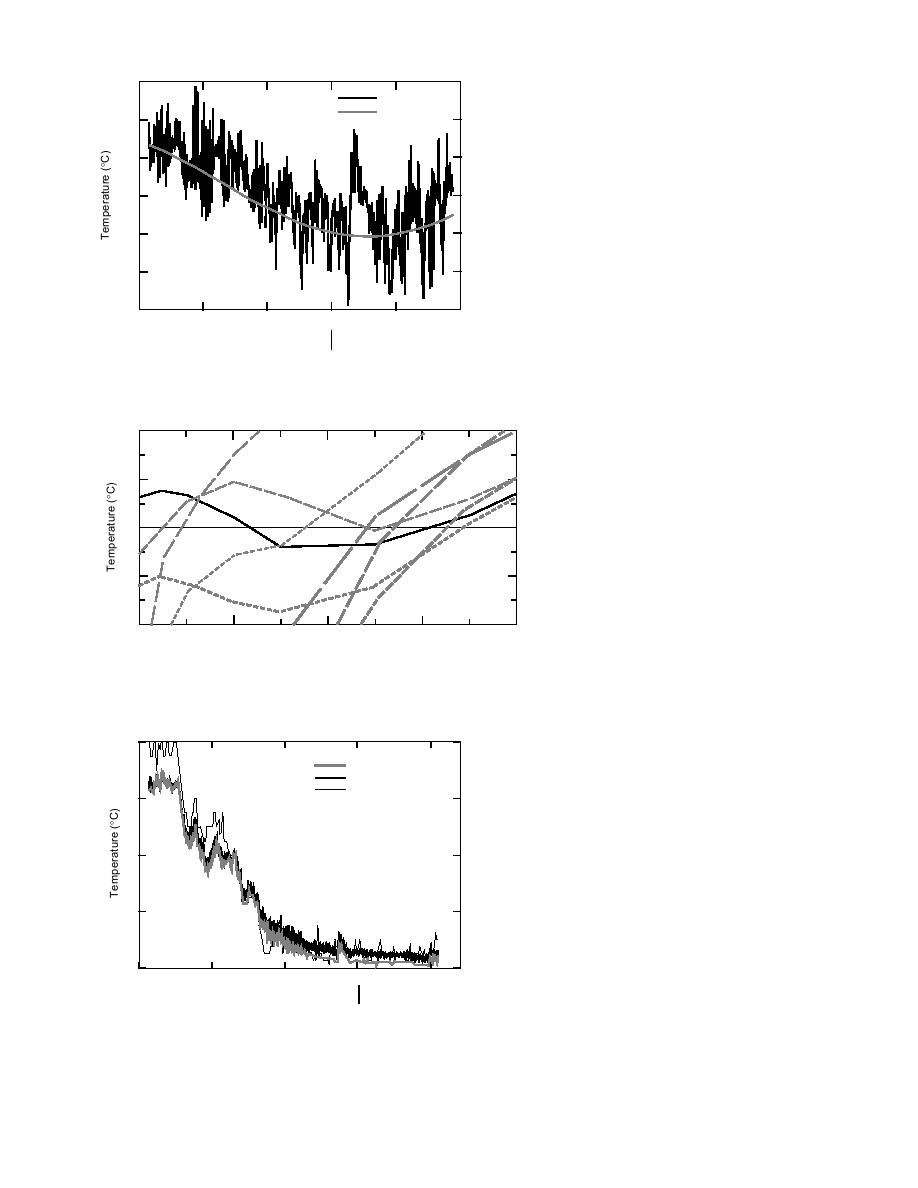
frost penetration reacts quickly to surface
30
Air
temperature conditions. Figure 15 shows
FE Surface
how rapidly the 0C isotherm changed
20
depth in the ledge, depending upon the sur-
face temperatures. The maximum frost pen-
10
etration that we recorded on Labossiere
Street was about 1.1 m (3.5 ft).
0
Pipe temperatures
10
Berlin has very cold water in its distribu-
tion system, which makes it a challenge to
20
design effective insulation. Figure 16 is a
graph of water temperatures at the treat-
30
ment plant and at the immersion thermo-
3 Sep
13 Oct
22 Nov
1 Jan
10 Feb
22 Mar
couples in the pipe at Labossiere Street. It is
1994
1995
evident from this figure that in September
Figure 14. Air temperature vs. FE surface temperature.
the water at the plant is warmer than at the
beginning of Labossiere Street (the lower
immersion thermocouple) and has
therefore lost heat to the ground as it
2
flowed to Labossiere. As the winter
Control 8 Dec 94
season progresses, there are periods
30 Jan 95 12 Jan 95
27 Mar 95
where the treatment plant water has
1
warmed up as it has traveled to
17 Mar 95
Labossiere.
0
The lower and middle immersion
thermocouples are roughly the same
22 Dec 94
depth below the surface, and the up-
1
13 Feb 95
per thermocouple is 1.2 to 1.5 m (4 to
6 Mar 95
5 ft) deeper. We can compare the low-
er and middle thermocouples (Fig.
2
0
1
2
3
4
17) and see that the middle thermo-
Depth (ft)
couple is about 0.5C warmer than
Figure 15. Control string vertical temperature profiles.
the lower, showing the temperature
rise of the water as it travels up the
street. The upper thermocouple shows the
warmest temperatures, but this would be ex-
16
pected because of its greater depth. This makes
Low Imm (4.76 ft)
it difficult to use the upper thermocouple to
Mid Imm (5.26 ft)
draw any conclusions about any beneficial
Treatment Plant
12
effect from the insulation.
We were concerned that cold air flowing
through the storm drain that passes over the
8
water pipe at the beginning of Labossiere would
hasten freezing in the immediate area. As can
be seen from Figure 18, the temperatures
4
recorded at the bottom of the storm drain were
in fact warmer than the lower immersion ther-
mocouple nearby. We do not know if this would
hold in a year with colder air temperatures.
0
23 Oct
12 Dec
31 Jan
22 Mar
3 Sep
1994
1995
Shield temperatures
In comparing temperatures inside and out-
Figure 16. Comparison of lower and middle immersion
side the shield at the 1.5-m (5-ft) depth (Fig.
thermocouples and filter plant temperatures.
12


 Previous Page
