As a result we concluded that some type of liner
1.4
was required for the settling pond. We briefly in-
vestigated the feasibility of using a geosynthetic
S = 100% for Gs = 2.35
liner, but cost and availability considerations led
1.2
us to explore other options to reduce the potential
infiltration into the EOD pad. We were made
aware of a peaty silt material that was available in
1.0
abundance near Fort Richardson. This material
In-situ
appeared to have a very high organic content,
Water Content
making it unsuitable for most engineering projects.
0.8
However, since this material was readily available,
20
30
40
50
60
we decided to evaluate its suitability as a liner for
Compaction Water Content (%)
the settlement pond.
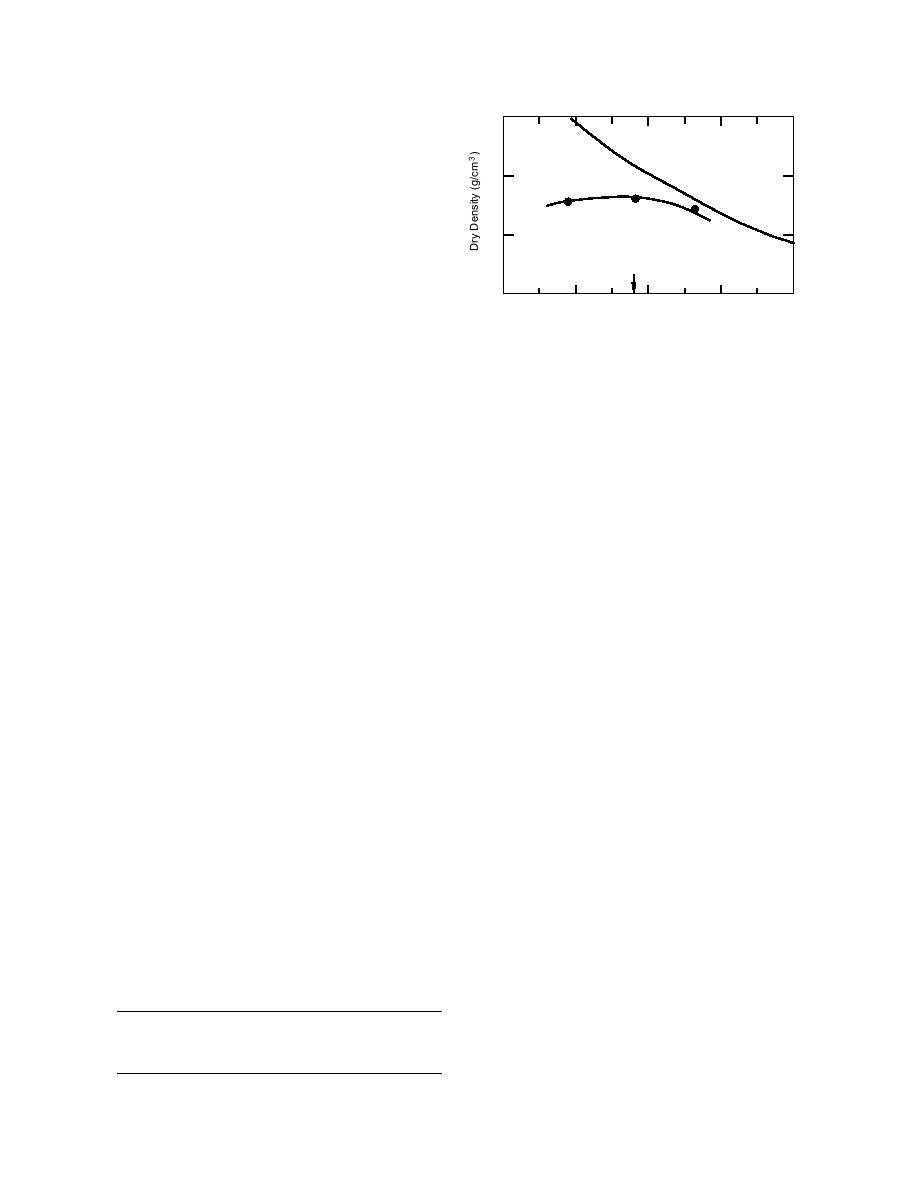
Figure 11. Results of Proctor tests of peaty silt.
To do this we subjected samples of the peaty
silt to compaction and hydraulic conductivity tests
in the CRREL laboratories. The laboratory com-
paction (standard Proctor) and hydraulic conduc-
creasing stress level. The results (Fig. 12c) for the
tivity tests were conducted according to ASTM
test specimen with a water content of about 29%
(9% below optimum) did not pass the 1 105 cm/
standard methods D 698 and D 5084, respectively.
The compaction water contents ranged from about
s litmus test. This was not unexpected, as accord-
29% to about 46%, bracketing the initial in-situ (in
ing to Lambe and Whitman (1969) the hydraulic
the borrow pit) water content estimate of about
conductivity for fine-grained soils significantly in-
38%. The results of the compaction tests are tabu-
creases at water contents below the optimum level.
lated in Table 6 and shown in Figure 11. The opti-
The importance of this finding is that the field
mum water content for the peaty silt material is
water content during compaction must be near or
about 38%, the same as the expected in-situ water
above 38%. This appeared to be no problem as the
content. This result appeared fortuitous, because
water content in the borrow pit was estimated to
it meant that we might not have to make a special
be 38%.
effort to adjust the water content of the peaty silt.
Laboratory hydraulic conductivity tests were
Field tests
conducted for the same water content regime as
The first field tests were conducted in the natu-
the compaction tests. The tests were conducted for
ral gravel surface of the pad. The second tests were
conducted through a layer of sludge obtained from
effective stress levels of 7, 14 and 35 kPa (1, 2 and
the Eagle River Flats, and a third test through two
5 psi) to determine the effectiveness of increasing
layers of sludge sediment. A fourth test was per-
thickness (e.g., increasing stress) as the sediment
formed through a peaty silt layer compacted on
thickness increases during the dredging opera-
the gravel surface inside the test chamber (barrel).
tions. The results are tabulated in Table 7 and il-
Later tests were conducted directly in the peaty
lustrated in Figure 12. The two tests conducted at
silt once it was compacted in the retention basin.
38% and 46% (above optimum) water content
The locations of these initial in-situ tests are shown
showed hydraulic conductivities less than
in Figure 13.
The site for the first series of tests was selected
to be representative of the EOD pad. Modified bar-
rels were used for the test chambers. The bottoms
of 82.5-L steel barrels, 40 cm in diameter and 64
Table 6. Laboratory compaction test results for
cm high, were removed and the barrels were set
peaty silt.
into the test pad as illustrated in Figure 14. The
barrels were set into circular channels cut carefully
Water
Dry
into the pad to about a 15-cm depth. The annular
Sample
content
density
(g/cm3)
number
(%)
space between the outer barrel walls and the gravel
was backfilled with a wet mixture of sand and
PS-3
28.8
1.116
bentonite clay to prevent leaking of the water
PS-1
38.2
1.130
placed in the barrel for the infiltration tests. The
PS-2
46.4
1.087
interior annulus was refilled with a mixture of
15


 Previous Page
