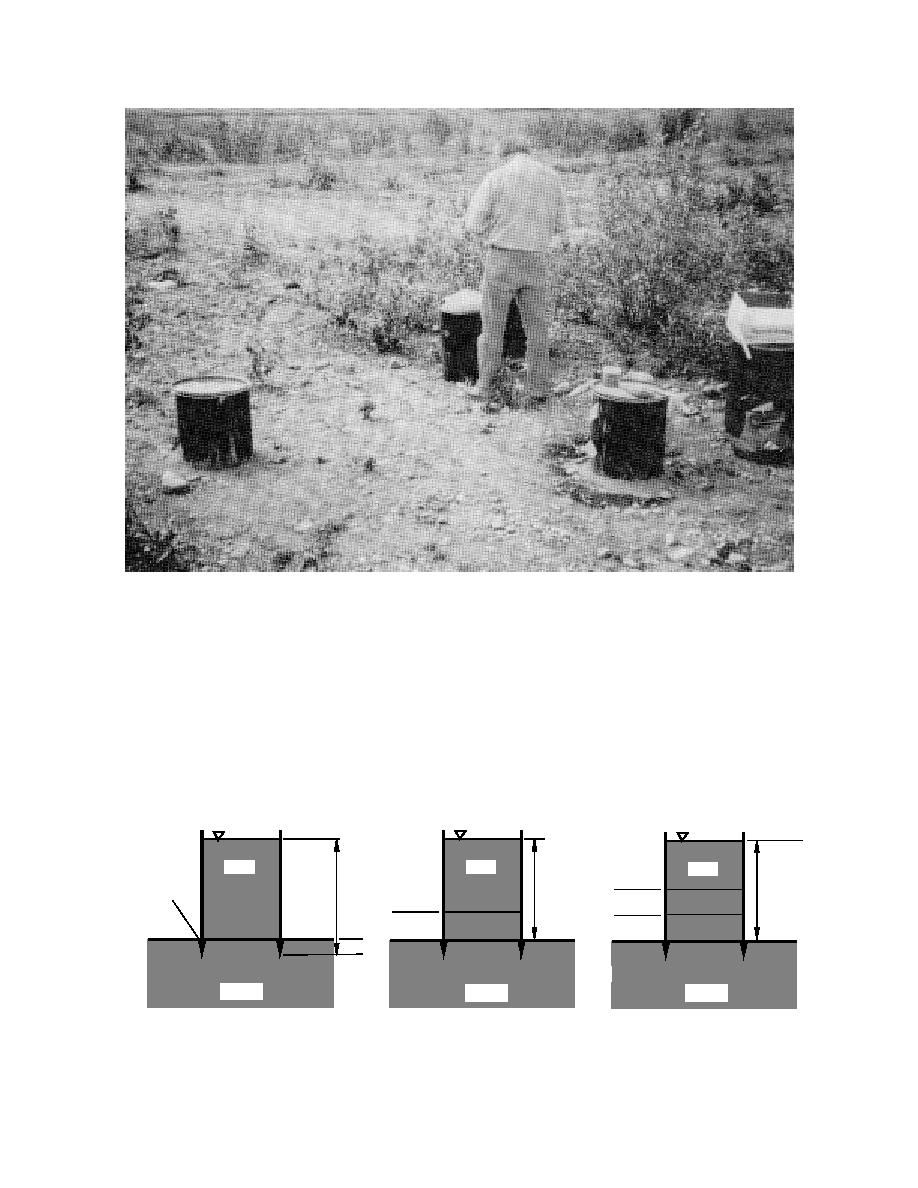
b. Test site.
Figure 13 (cont`d). Hydraulic conductivity barrel test cells on the EOD pad.
native gravel and sand. To estimate the hydraulic
the test barrel. Water was then added until the in-
conductivity of the bare gravel pad without either
filtration rate was about constant. The barrel was
then filled again with water to the 30-cm level and
the sediment or the peaty silt liner, the barrel (Fig.
the rate of infiltration into the test pad was mea-
14a) was filled with water obtained from Eagle
sured. To estimate the hydraulic conductivity of
River Flats (near the edge of the EOD pad) to a
the ERF sediment on the gravel surface of the EOD
depth of about 30 cm. This water was allowed to
soak into the pad to saturate the gravel beneath
pad, water from the Flats was placed in the barrel
Water
Water
Water
Bentonite-sand
Grout
h
h
h
(typical)
Hsludge
Hsludge
Hsilt
Hgravel
Gravel
Gravel
Gravel
Gravel
Gravel
Gravel
Sl d
il
b. Sediment on gravel.
a. Water on gravel (unmodified pad).
c. Sludge on peaty silt.
Figure 14. Schematics of barrel tests on EOD pad.
18


 Previous Page
