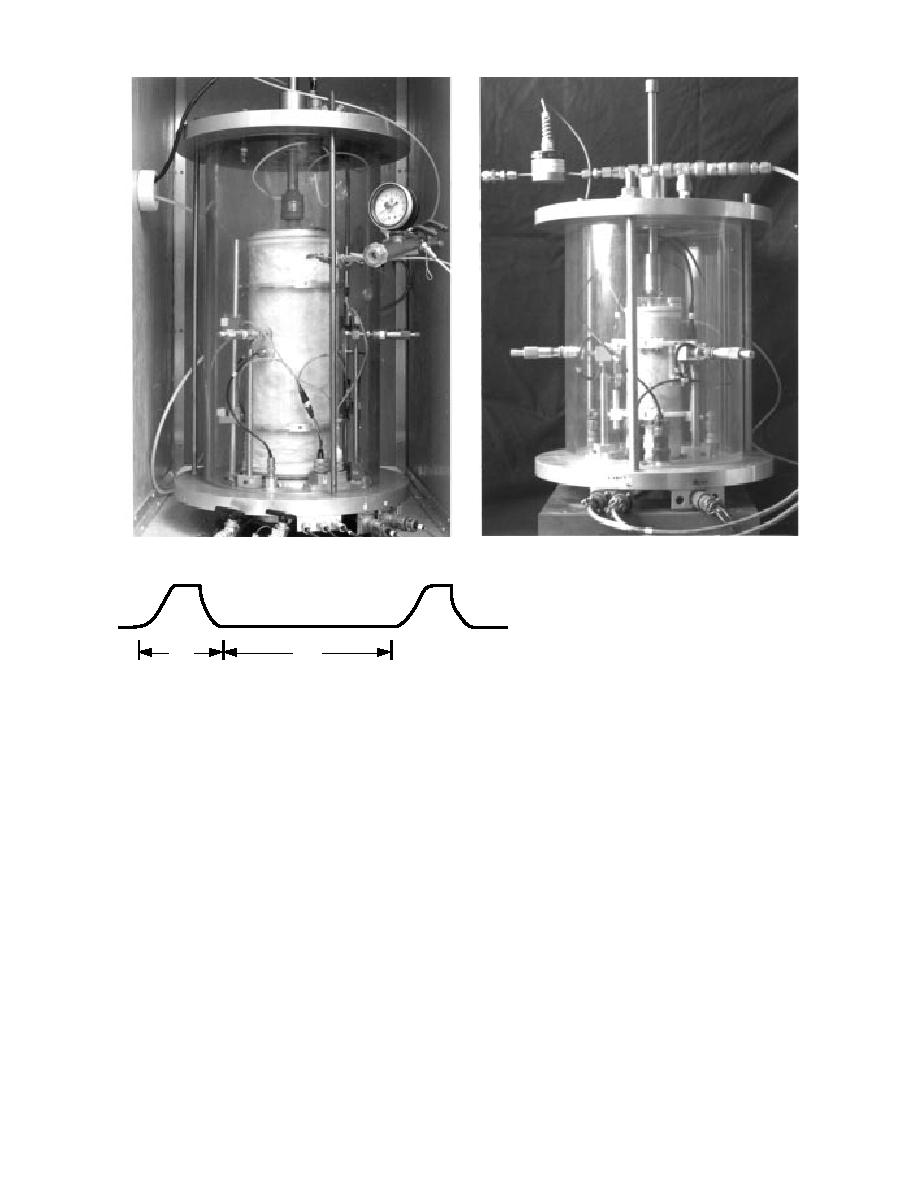
Figure 1. Examples of triaxial cells. Cells for 15.2- (left) and 5.1-cm-diam. specimens.
2.0C (23.0, 26.6 and 28.5F); all other
specimens were tested at 7.0, 5.0, and
2.0C (19.5, 23.0 and 28.5F). The cy-
clical deviator stress was applied at each
1s
2s
test point until the resilient axial strain
Figure 2. Waveform used in Mn/ROAD resilient
modulus
remained a constant value, which occurred
testing.
at about 70100 applied cycles.
Once the tests on the frozen specimens
For this study, the waveform used to apply the
were completed, they were allowed to thaw in the
cyclic deviator stress was the waveform shown in
triaxial device and subsequently retested in a
Figure 2. The pulse length is approximately 1 sec-
thawed, saturated state. For the coarser-grained
ond with 2 seconds between pulses. Table 3a illus-
materials, the specimens were then allowed to drain
trates the sequence of stress conditions applied to
in place, and tested again. Increasing amounts of
the unfrozen specimens, whether thawed or never
suction were applied to the base and subbase speci-
frozen. We applied only the stress combinations
mens to bring them to various moisture states, and
that would avoid excessive permanent strains in
additional test points were determined.
the specimens (5% decrease in axial length), de-
pending on the moisture condition and estimated
Previously tested materials
available strength. The frozen specimens were
In order to conduct the follow-on modeling of
tested holding the confining pressure constant at
predicted damage at the test sections of the Mn/
69 kPa (10 lb/in.2) and varying the deviator stress
ROAD facility, resilient modulus characterization
as shown in Table 3b. The frozen specimens were
was needed for two additional Mn/DOT subbase
tested at three temperatures: class 6 special speci-
materials, class 4 special and class 5 special. We
mens were tested at approximately 5.0, 3.0, and
looked through CRREL's collection of material
5


 Previous Page
