

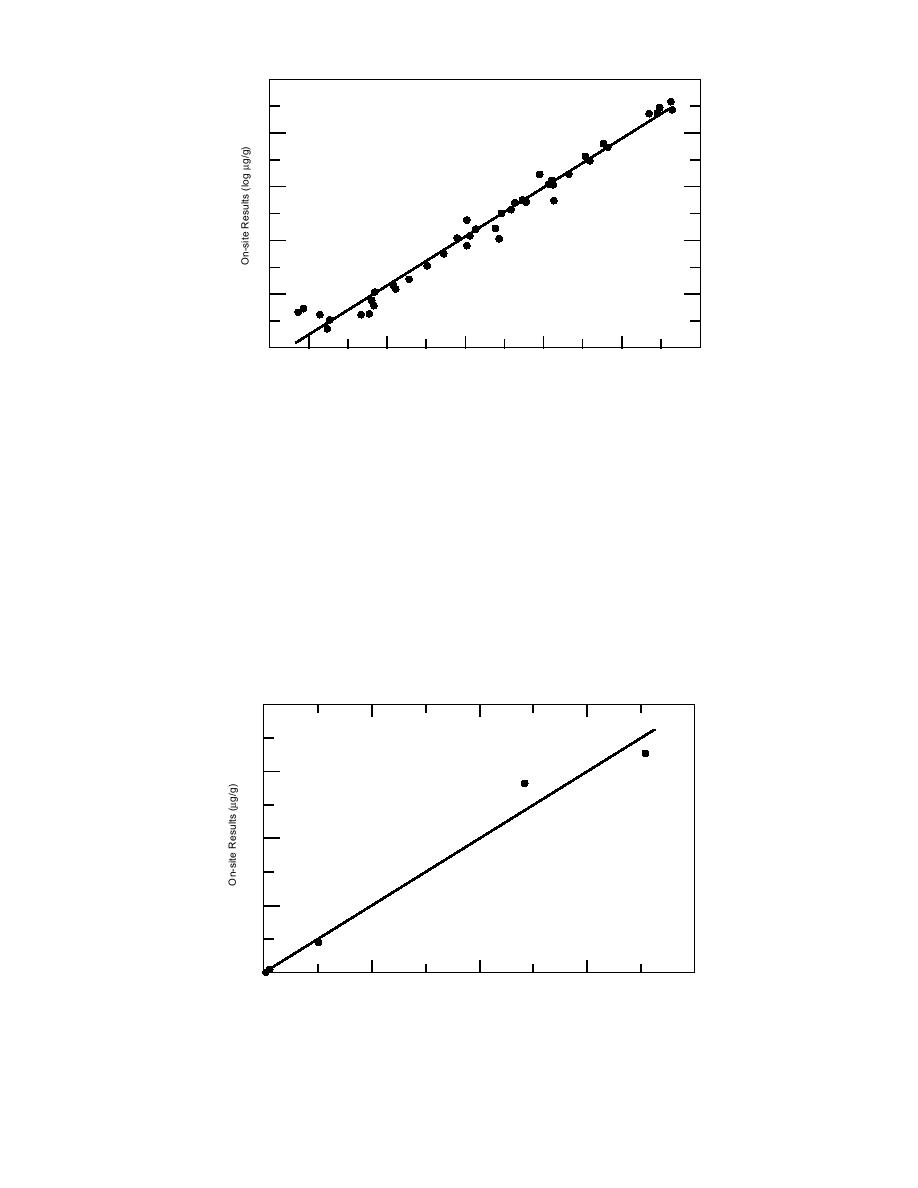
5
4
3
2
r = 0.988
Slope = 0.919
1
y-intercept = 0.241
0
2
3
4
5
0
1
Laboratory Results (log g/g)
Figure 9. Log-transformed TNT concentrations from sampling locations 1,
3, 4, 5, 8, 9--linear model with intercept.
samples is specific to location 3 or is simply due
relationships with zero intercept were equal to
to inaccuracy of the method at very low concen-
those with non-zero intercept, which we interpret
trations.
to mean that the y-intercepts were not signifi-
Figure 10 presents the results of a correlation
cantly different from zero and that the slope (of
of on-site vs. lab results for the composites for
the zero intercept line) can be considered an over-
these same six sampling locations. For the com-
all measure of the accuracy of the field method
posites, each point represents a mean of seven on-
relative to the lab method. Using this interpreta-
site and seven lab determinations. The on-site
tion and the computed slopes from the zero inter-
and lab data were even more strongly correlated
cept models, we found the accuracy across these
for the composites (r = 0.989) and the slope of the
six sampling locations at three different installa-
best fit linear relationship was 0.999. In both cases
tions, with concentrations varying from near the
detection limit of 1 g/g to over 40,000 g/g, to be
the correlation coefficients for the best fit linear
3
16 x 10
12
8
r = 0.989
4
Slope = 0.999
y-intercept = 69.3
0
4,000
8,000
12,000
16,000
Laboratory Results (g/g)
Figure 10. Untransformed TNT concentrations for composites from sampling
locations 1, 3, 4, 5, 8, 9--linear model with intercept.
33

 Previous Page
