locations 2, 6 and 7 were not used in this correla-
However, the analytical precision was so good
tion. Results from sampling location 2 were elimi-
that a significant difference was detected in the
nated because the major analyte present was DNT
replicate analyses of the composite, even though
rather than TNT and the relationship between the
the mean concentrations of the field and lab re-
sults were 16.6 and 14.9 g/g respectively. The
two methods is different. Similarly, contamina-
tion at location 6 was largely ammonium picrate.
excellent agreement of on-site and lab results for
Results from location 7 were not used because the
sampling location 9 is particularly encouraging
major portion of the soils at this location were
because the range of concentration encountered
is quite low (440 g/g) and yet the two methods
stones, and about 50% by weight of each sample
processed in the field was eliminated prior to
provided very comparable results.
laboratory analysis, thereby introducing a large
bias between methods.
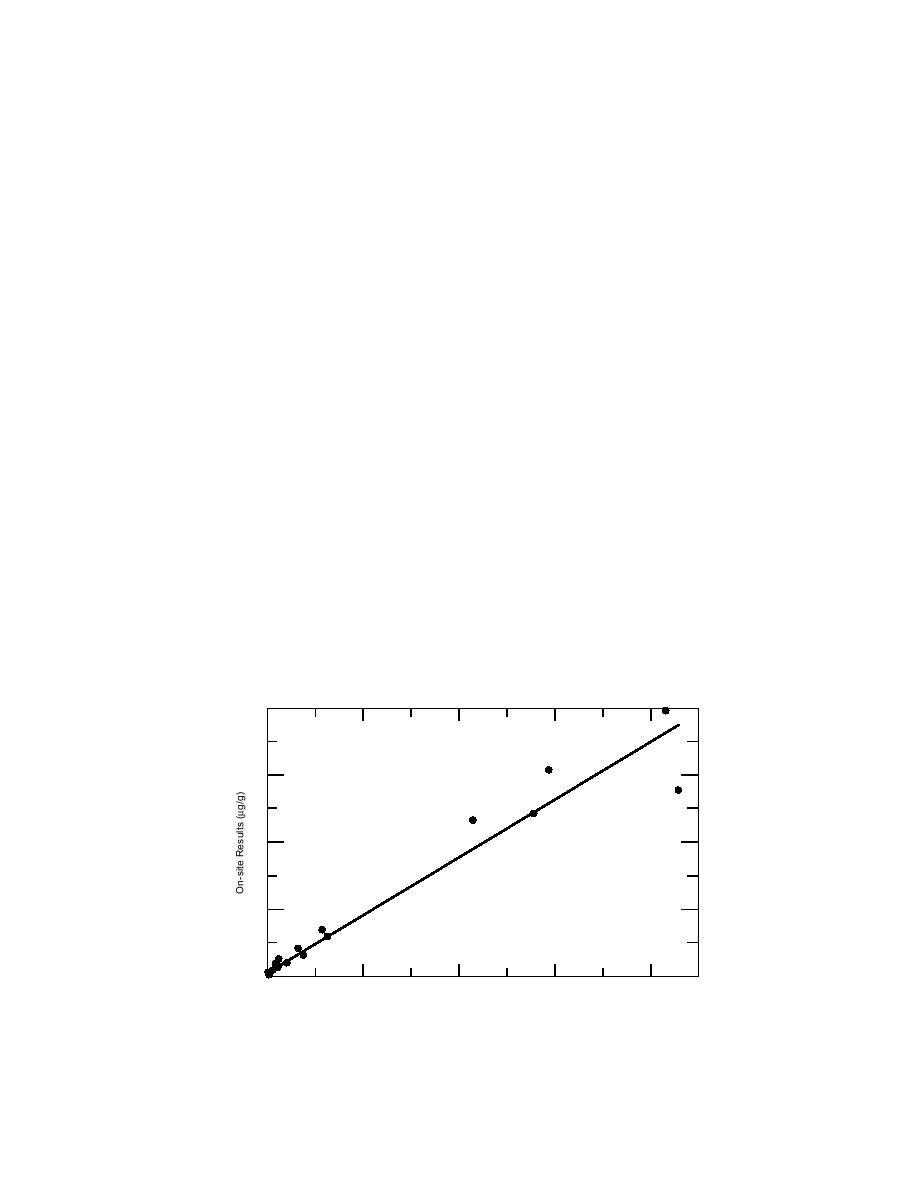
Correlations of the results from the six loca-
SUMMARY OF RESULTS
tions are presented in Figures 8 and 9. The results
for the means of duplicates for the seven discrete
The results of this study provide information
samples at each of the six sampling locations show
on several topics critical to efficient and appropri-
a very strong correlation between the on-site and
ate characterization of explosives-contaminated
laboratory results (r = 0.979), with a slope of the
sites. The first compares the capabilities of colori-
best fit linear regression line of 0.867 (Fig. 8). Be-
metric on-site analysis for TNT, DNT and ammo-
cause this plot includes concentration data, in
nium picrate in soil to laboratory analysis by
which the numerical values cover about five or-
HPLC. Secondly, this study directly compares ana-
ders of magnitude, it is difficult to see the correla-
lytical and sampling error, thereby allowing de-
tion for low-concentration data in Figure 8. Thus,
velopment of strategies for improving data qual-
we plotted the on-site vs. lab data on a log-log
ity. Third, the results provide some guidance on
sampling strategies for collecting representative
basis as well so that the characteristics of the rela-
tionship can be seen equivalently at different ab-
samples, despite the enormous heterogeneity
solute concentrations (Fig. 9). Clearly, the log-log
present at these sites.
plot shows that the linear relationship between
To assess the overall performance of the TNT
on-site and lab results is very strong for lab val-
colorimetric on-site analysis method across the
ues above a log value of about 0.6 (concentration
soils from the three installations, the numerical
about 4 g/g). Data below this value are all from
on-site analysis results for sampling locations 1,
3, 4, 5, 8 and 9 were correlated with the corre-
sampling location 3, and it is not clear whether
sponding laboratory results. Data for sampling
the poor correlation for these low-concentration
40 x 103
30
20
r = 0.979
10
Slope = 0.867
y-intercept = 282
40 x 103
0
10
20
30
Laboratory Results (g/g)
Figure 8. Untransformed TNT concentrations from sampling locations 1, 3, 4,
5, 8, 9--linear model with intercept.
32


 Previous Page
