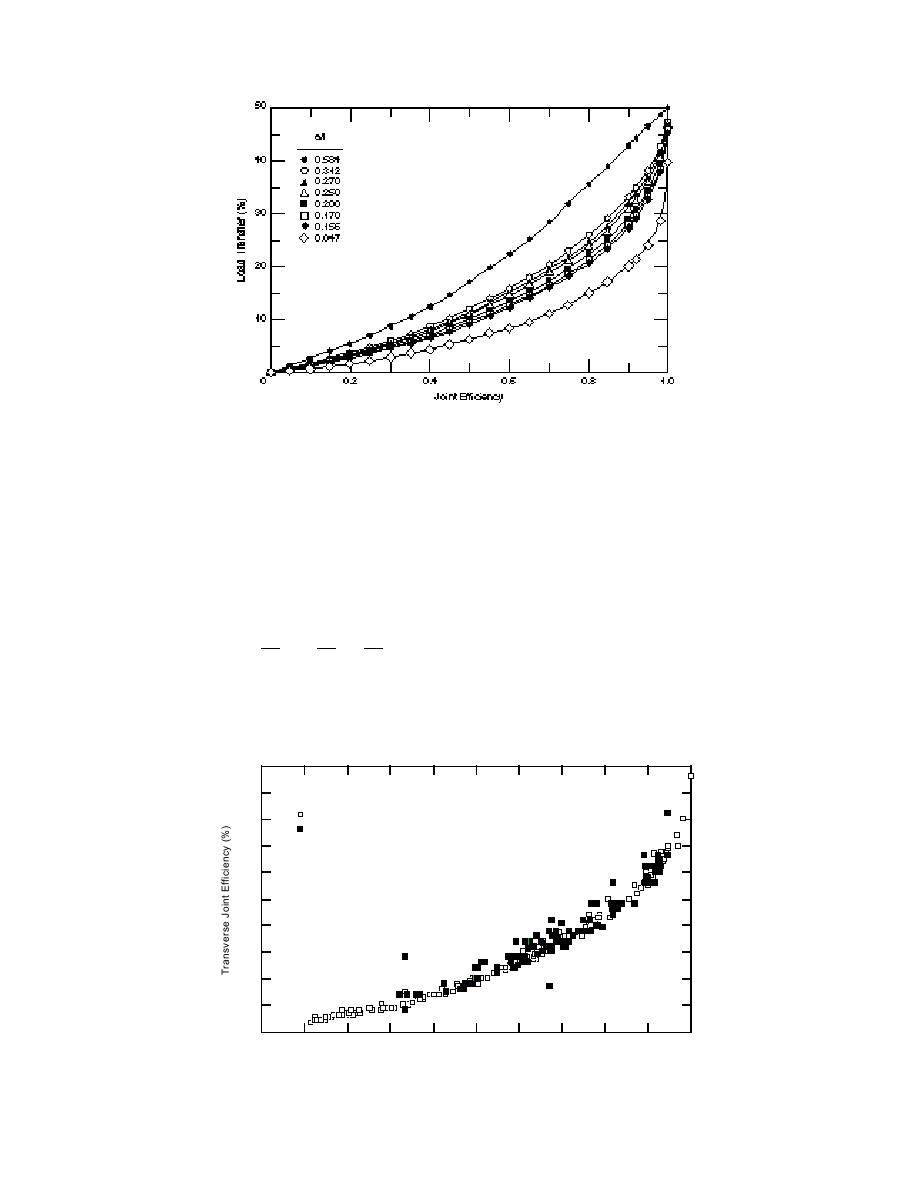
Figure 44. Interpolated relationships between joint efficiency and load
transfer as a function of a/l (after Hammon and Pittman 1993).
With the ratio of radius of the FWD loading plate (a) to
this relationship and is in the form of
the radius of relative stiffness (a/l) and the joint effi-
l = 0.5 - (1.24 AREA) + 1.21AREA2 - 0.1803AREA3
ciency, Figure 44 was used to calculate the load transfer
efficiency. Figure 44 was developed by Tabatabaie et
al. (1979) and modified by Hammons and Pittman
+ 0.011098AREA4 - 0.0003075AREA5
(1993). The results of the load transfer across trans-
verse joints were determined at both CWA and OCA
+ 0.000003198AREA6
and are presented in Figure 45. We found that the rela-
tionship below can be used to estimate the LTE of trans-
and
verse joints using FWD JTE data.
δ δ
δ
AREA = 61 + 2 1 + 2 2 + 3
δ0
δ0 δ0
LTE (%) = 1.912e3.115(JTE)
where l = radius of relative stiffness (inches)
δi= FWD deflections (inches)
where JTE is joint transfer efficiency (decimal).
We did not attempt to develop similar relationships
AREA = normalized deflection basin area
for the longitudinal joint because of the low JTE values
i = deflection sensor number.
50
Central Wisconsin Airport
Transverse Joints
OCA
40
CWA
30
20
10
0
20
40
60
80
100
Joint Transfer Efficiency (%)
Figure 45. Relationship between JTE and LTE for transverse joints.
36


 Previous Page
