or, with respect to total basin area, an estimate could be
and also because of the small database. However, be-
made using
cause of the unique relationship between JTE and LTE
shown in Figure 45, it may be possible to apply the
σtensile = 7.35AT
same relationship to longitudinal joints.
where σtensile = horizontal tensile stress at the bottom
To meet the criterion that the LTE of the joint be not
of the PCC layer (kPa)
less than 25%, the JTE should exceed 80%. If this is the
k = coefficient of subgrade reaction
case, a review of Tables 11a and 12a indicates that
(MN/m3)
many of the joints at CWA and OCA were below capac-
t = PCC layer thickness (mm).
ity during the thawing period. At the end of thaw, nearly
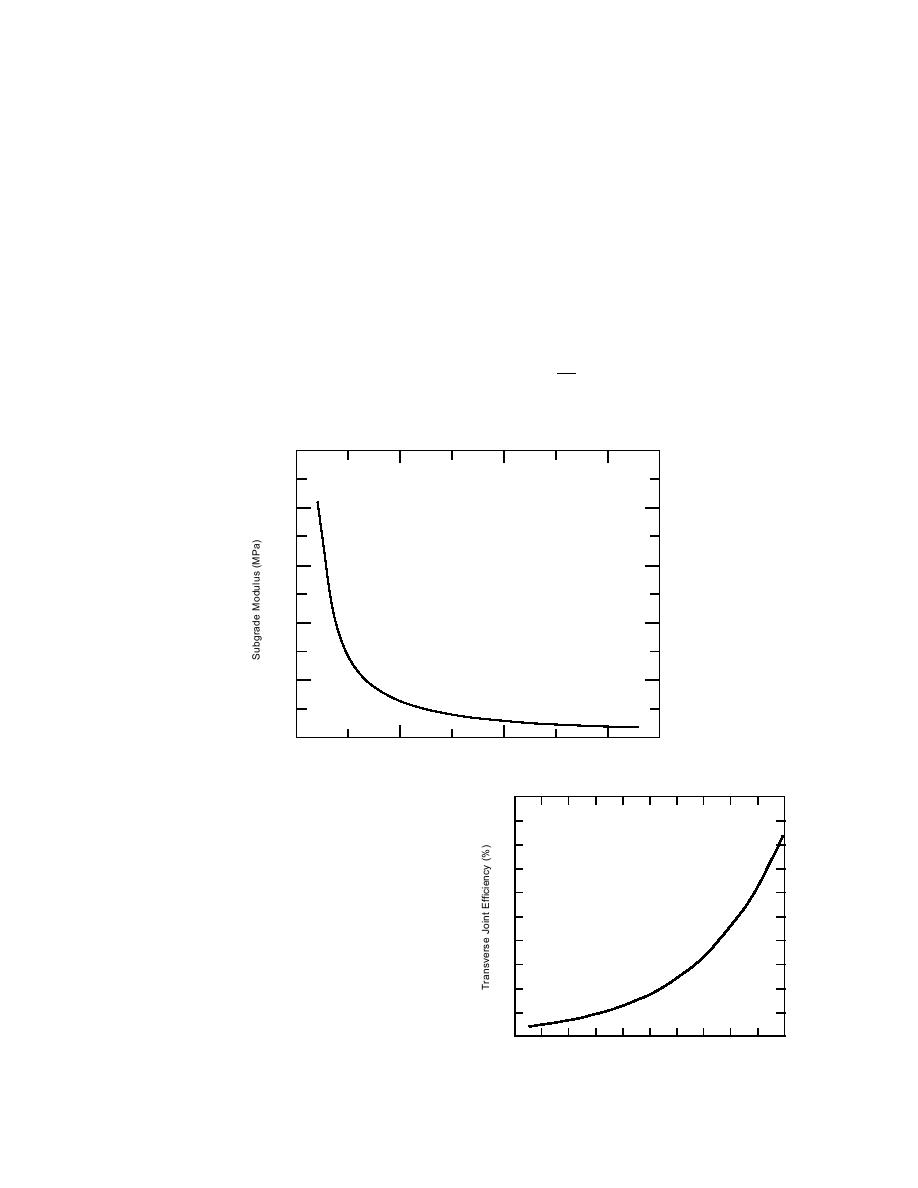
The LTE across transverse joints can be estimated from
all of them met the 25% criterion. The results indicate that
the JTE from Figure 47 or from the following equation
most of the damage to transverse joints probably occurs
during the winter and spring thawing period.
LTE (%) = 1.912e3.115(JTE)
where JTE is the joint transfer efficiency (decimal)
PROPOSED PAVEMENT
δu
EVALUATION PROCEDURE
JTE =
δi
A methodology is proposed for evaluating pave-
and δu is FWD deflection on an unloaded slab and δi is
ment performance during the thaw-weakening periods
FWD deflection on a loaded slab.
using FWD deflection data. From this study, we found
2500
2000
1500
1000
500
0
200
400
600
Total Basin Area (mm 2 )
Figure 46. Relationship between total basin area and subgrade modulus.
50
that, for PCC pavement, the composite subgrade mod-
ulus (base and subgrade) can be estimated from the de-
flection basin area and Figure 46 or from the following
40
equation
Esub = 154,319∆1.1708
30
where Esub is the subgrade modulus (MPa), and ∆ is
deflection basin area (mm2). The horizontal tensile
20
stress at the bottom of the PCC layer was found to be a
function of pavement thickness and Esub or the coeffi-
cient of subgrade reaction (k) from the following equa-
10
tions for either a Boeing 757 or for a MD-DC9.
σtensile = 7360 1.5Esub 17t
0
20
40
60
80
100
σtensile = 7389 3.02k 17.5t
Joint Transfer Efficiency (%)
Figure 47. Relationship between JTE and LTE.
37


 Previous Page
