either side of the joint from an applied load. Load (or
stress) transfer is the ratio of amount of stress that is
transferred across the joint. For a perfect transfer,
50% of the stress is transferred across the joint.
From his study, Foxworthy (1985) reported the fol-
lowing:
1. JTE increased with increasing temperature and
the relationship between JTE and temperature was the
same whether he used air or pavement temperatures.
2. The type of joint construction affected the rate at
which LTE changed with temperature.
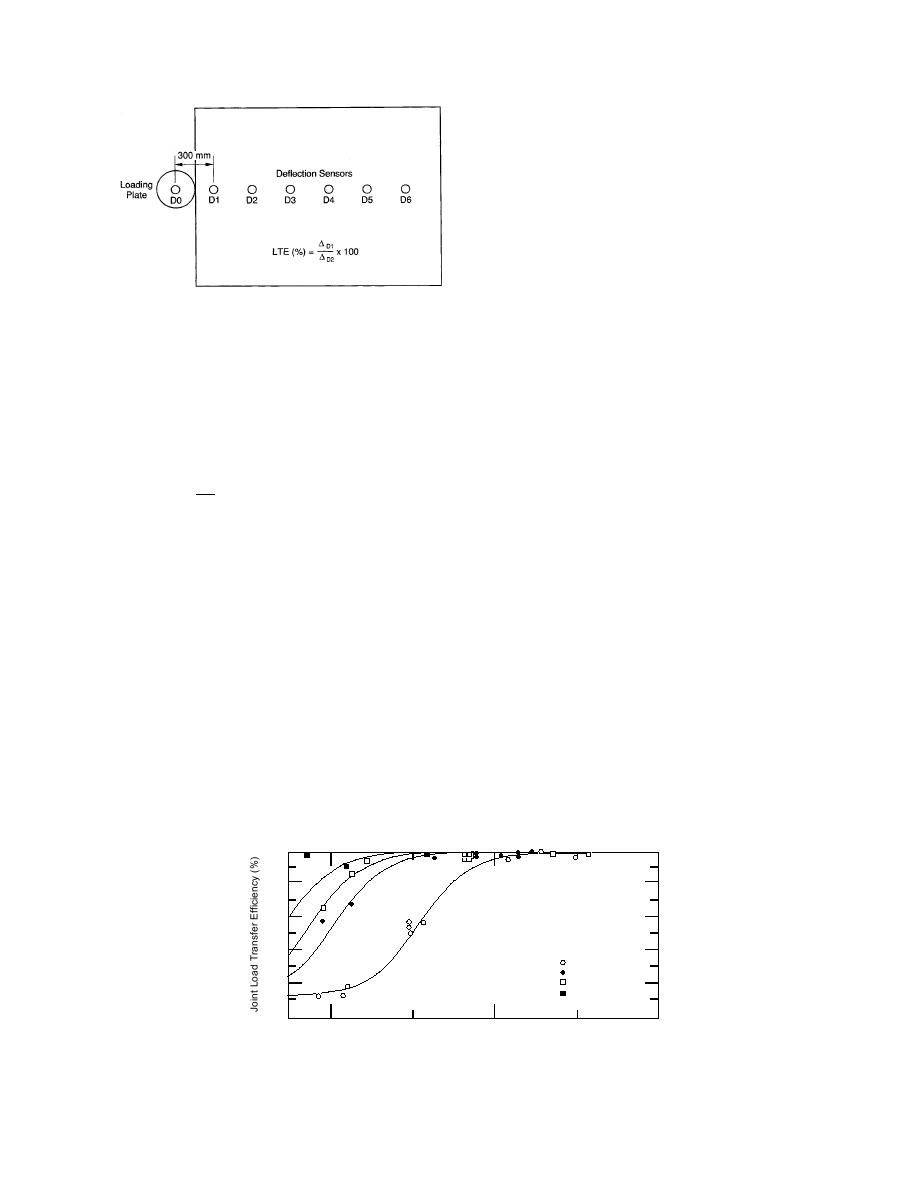
Figure 38. Placement of FWD sensors for load trans-
3. The JTE was not affected by the FWD load used
fer efficiency test.
during the test.
4. The JTE was the same across transverse joints
to determine the amount of deflection on either side of
when measured from the approach or leave slab on
the joint as illustrated in Figure 37.
airfield pavements (see Fig. 37). However, across lon-
The Corps of Engineers' method (TM 5-826-5, U.S.
gitudinal joints, the LTE values were higher when
measured from the leave slab.
Army, no date) for calculating the Joint Transfer Effi-
Foxworthy (1985) developed relationships for pre-
ciency (JTE) using the deflections obtained with the
dicting the LTE. He found that, in general, an S type
FWD is
curve could be used to fit his results concerning load
δ1
JTE =
transfer efficiency and temperature (Fig. 39). The
δ0
JTEtemperature relationships obtained by Foxwor-
thy were from tests conducted at different times of the
where JTE = joint transfer efficiency
δ0 = center plate deflection
day where the only changes that were occurring were
δ1 = deflection measured across joint.
in the PCC layer. Since the base and subgrade
strengths were changing very little with time, these
results may not be applicable to pavements during
With the FWD, the center sensor was placed on one
thaw-weakening periods. So, we used the limited data
side of the joint and the second sensor, located 300 mm
away from the center of the loading plate, was placed
collected at OCA and CWA to study the effects of
across the joint. This is illustrated in Figure 38. The
changing subbasesubgrade stiffness during spring
JTE values across the transverse, longitudinal and cor-
thaw on JTE.
ner joints, as calculated from the equation above for
Loads were transferred across transverse joints
both CWA and OCA, are presented in Tables 11 and
with dowels or aggregate interlocks and across longi-
12. The JTE values presented in the tables are the aver-
tudinal joints by the use of keyways, aggregate inter-
age from the four drop heights (joint and load transfer
locks or tiebars. Typical changes at CWA are shown in
have been used interchangeably in the literature). In
Figures 40 and 41. We found two basic trends at CWA
this report, a distinction is made between joint (JTE)
and only the first at OCA:
and load transfer efficiency (LTE). Joint transfer effi-
1. In general, the transverse JTE increased with in-
ciency as shown above is the ratio of the deflections on
creasing temperature, similar to that reported by Fox-
100
80
60
40
Slab No. 1
2
3
20
4
0
4.4
26.7
48.9
Air Temperature (C)
Figure 39. Relationship between air temperature and transverse joint
transfer efficiency (after Foxworthy 1985).
31


 Previous Page
