Developing, installing and evalu-
16
ating real-time scour instruments
present real challenges. As proto-
types the instrumented fish were suc-
12
cessful. Several problems have been
32
identified (i.e., attachment, installa-
5.4
325.0
tion, polyethylene housing, etc.), and
8
the necessary revisions are incorpo-
rated into equipment reinstalled
325
2
6.
.8
32
prior to the 1994 breakup.
4
.4
325
FUTURE RESEARCH
Pier
0
Footing (elev: 325.0)
The use of ice thickness measured
prior to or following breakup intro-
4
10
0
10
20
30
duces errors in the calculated ice
Length from Pier Nose (ft)
pressure, skewing any comparisons
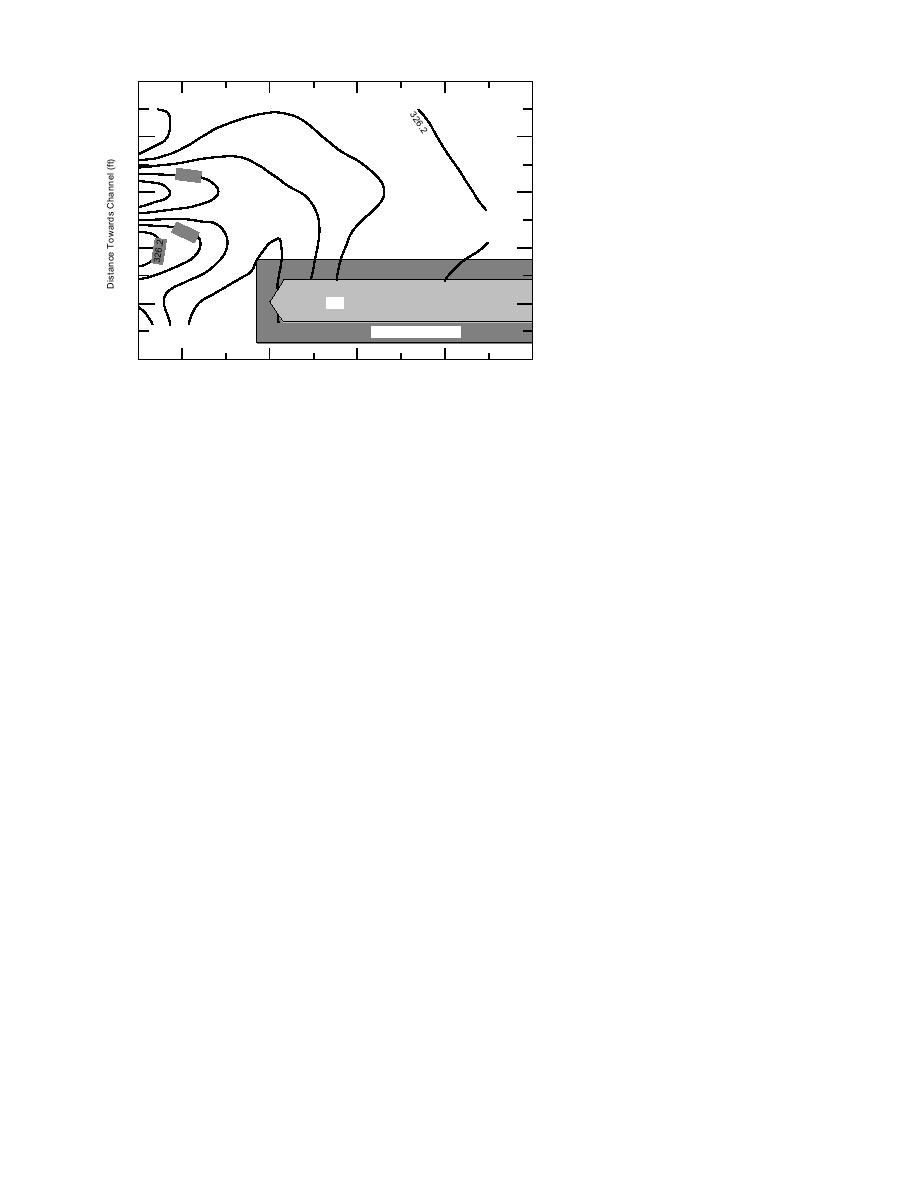
Figure 29. Contours of the scour hole.
with ice crushing strengths measured
in laboratory and field sites. The chal-
lenge is to measure the thickness of the ice con-
DISCUSSION
glomerate (i.e., single layer, multi-layer, brash,
The global ice loads have been measured with
etc.) just prior to impact. The current direction is
reliable results on the instrumented pier. The low
a refinement of the impulse radar technology. The
ice strength deduced from these measurements
velocity of the ice floe prior to impact also influ-
are in line with other measurements of ice strength
ences the crushing strength (Sodhi 1992). A radar
during spring breakup, when the inner structure
system that will continuously monitor this as-
of the ice has deteriorated (Michel 1970). The re-
pect of the breakup is currently under develop-
duced strength is also taken into account in the
ment.
AASHTO (1992) design code. For spring breakup
Using radio transmitters to monitor scour has
where the ice floes are "small," the code recom-
real promise. By modifying the mast and fish at-
mends using 100 psi as a crushing strength. To
tachment, we hope to reduce the damage caused
compensate for incomplete contact between the
by impact from debris and ice. For example, the
ice and the structure, the crushing strength can
attachment points will be located downstream
be modified based on the ratio of pier width b to
on the mast rather than protruding with eyebolts
ice thickness t. Using the 12-in. ice thickness, the
off to the side of the mast, which expose the fish
corresponding b/t ratio of 4 has a reduction coef-
to current and debris. A stiffer mast will shelter
ficient of 0.8. In essence the design crushing
the fish from the debris. A future modification
strength is reduced to 80 psi, or twice the crush-
would be to use smaller transmitters to allow
ing strength measured during the 1992 breakup.
closer spacing of the instrument fish, improving
Based on the 1992 and 1993 measurements this
the resolution of the measurements. The trade-
design criterion is conservative.
off is a reduction in service life. The concept of
Real-time measurement of the scour adjacent
using discrete measurements is acceptable where
to but independent of the bridge pier during the
scour is significant, such as adjacent to bridge
spring 1993 breakup is a first. This conclusion is
piers and abutments. To fully evaluate the im-
based on only one instrumented fish, but the con-
pact of river ice and structures on bed erosion,
cept of using motion sensors tethered to a mast
continuous monitoring of the bed elevation is re-
for monitoring scour has merit. What is interest-
quired. Several technologies are being evaluated,
ing is that the 23 in. of scour measured by the
but all require an instrumentation cable.
sediment chains had to erode and start to rede-
Water velocity enters into the existing equa-
posit in the early stages of breakup. This field
tions for scour (Richardson et al. 1993) and is a
measurement corroborates the measurements and
parameter that needs to be measured. Rather than
observations made in the flume studies by Bescha
subjecting delicate velocity probes to debris for
(1983) and Wuebben (1988).
direct velocity measurements, the approach is in-
18


 Previous Page
