No.1
No.2
No.3
No.4
36
421/2
44
36
20
21/2
60
130
90
30
6
70
170
100
40
80
6
180
110
6
190
50
6
150
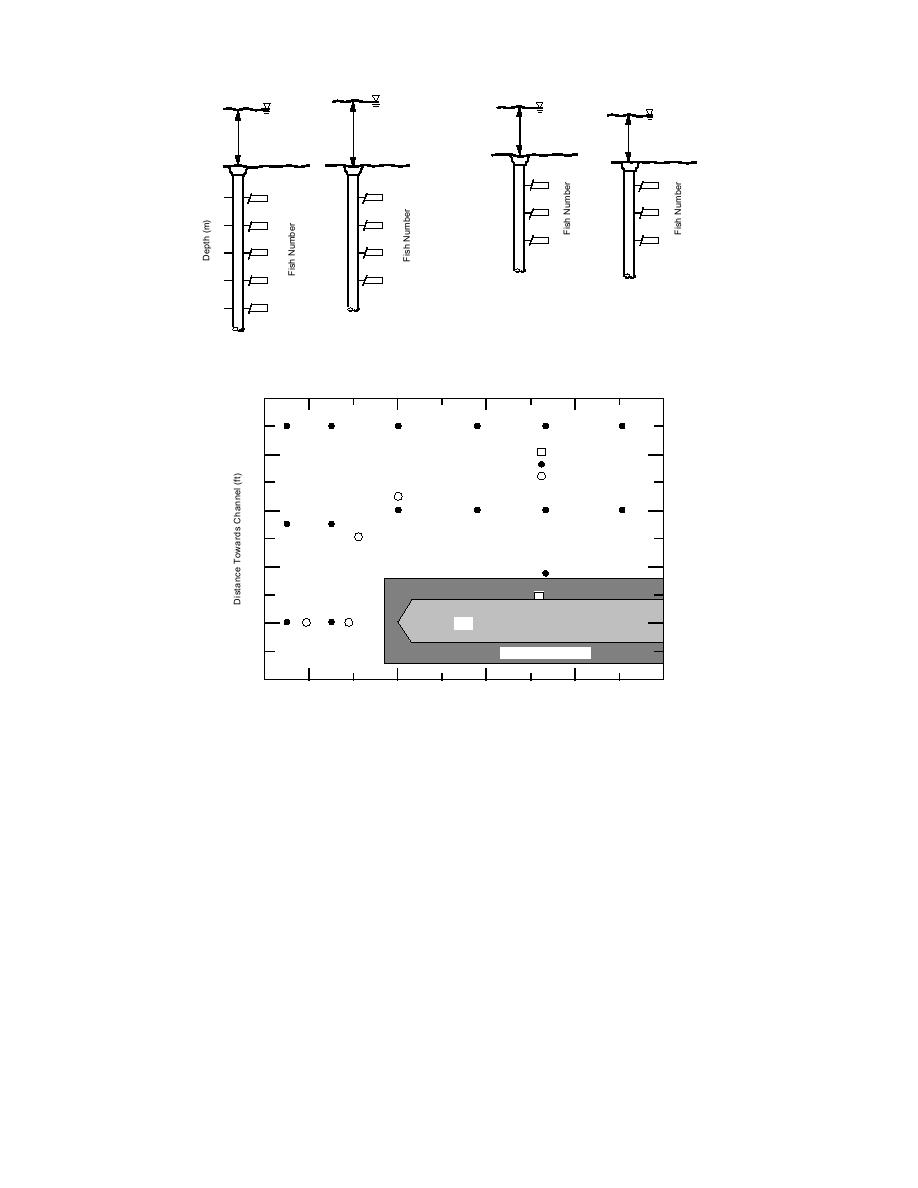
a. Elevation view of the fish. The fish are numbered according to their transmit-
ting frequency (in kHz) above the base frequency of 140 MHz.
16
Brisco Scour Monitor
12
Sediment Chain
Instrumented Fish
8
4
Pier
0
Footing (elev: 325.0)
4
10
0
10
20
30
Length from Pier Nose (ft)
b. Plan view.
Figure 25. Arrangement of the fish and sediment chains around the Route 5 bridge pier.
which the probe quickly penetrated with a few
With tension held on the string, the air probe
blows from a sledge hammer. After the hard layer
was extracted, leaving the sediment chain
was penetrated, bubbles were coming out of the
protruding just above the surface.
bed approximately 20 ft upstream of the pier.
One observation made while monitoring the
An array of 16 sediment chains were installed
instrumented fish was the attenuation of the sig-
around the pier (Fig. 25a) to passively document
nal due to the frazil ice particles. Following cold
scour depth. A compressed air probe (Fig. 27)
nights there was a high concentration of frazil ice
and the following procedure made installing the
in the water, increasing the signal scatter and re-
chains very easy:
ducing the amplitude of the received signal. Sig-
The air probe was jetted into the river bot-
nal strength also deteriorated but not as severely
tom;
as the ice sheet thickened. Despite the reduced
The access cap on the top of the air probe
amplitude and frequency of the received signal,
was removed;
the timing signals indicated that the fish were
A weight with an attached 3-ft chain and
stationary. The only change in state occurred in
string was dropped down the air probe; and
the early stage of breakup, when the water level
16


 Previous Page
