Peripheral parameters monitored in con-
junction with scour are the river stage, air
temperature and water temperature. The
140.010
140.220 MHz
pressure transducer for river stage and the
two water temperature thermistors are at-
tached to near-shore pier right side (Fig. 8).
Recorder
Beacon CM
Bed erosion and scour data
Programmer
acquisition system
Next
Scanner
Although the hardware for the Route 5
Period
data acquisition system (Fig. 14) is similar
Amplifier
to the ice force system, the software is con-
Water Level
HP 9835
siderably different. The supervisory pro-
Water Temperature
A/D
Air Temperature
gram running on the HP 9836 performed
Brisco Scour
two functions: monitoring transducers and
HP 9836
HP-IB Bus
controlling receiving equipment for the in-
Computer
strumented fish.
Transducers' output, including water
Disc
Printer
Drive
level, and air and water temperatures, was
measured and recorded at 15-minute in-
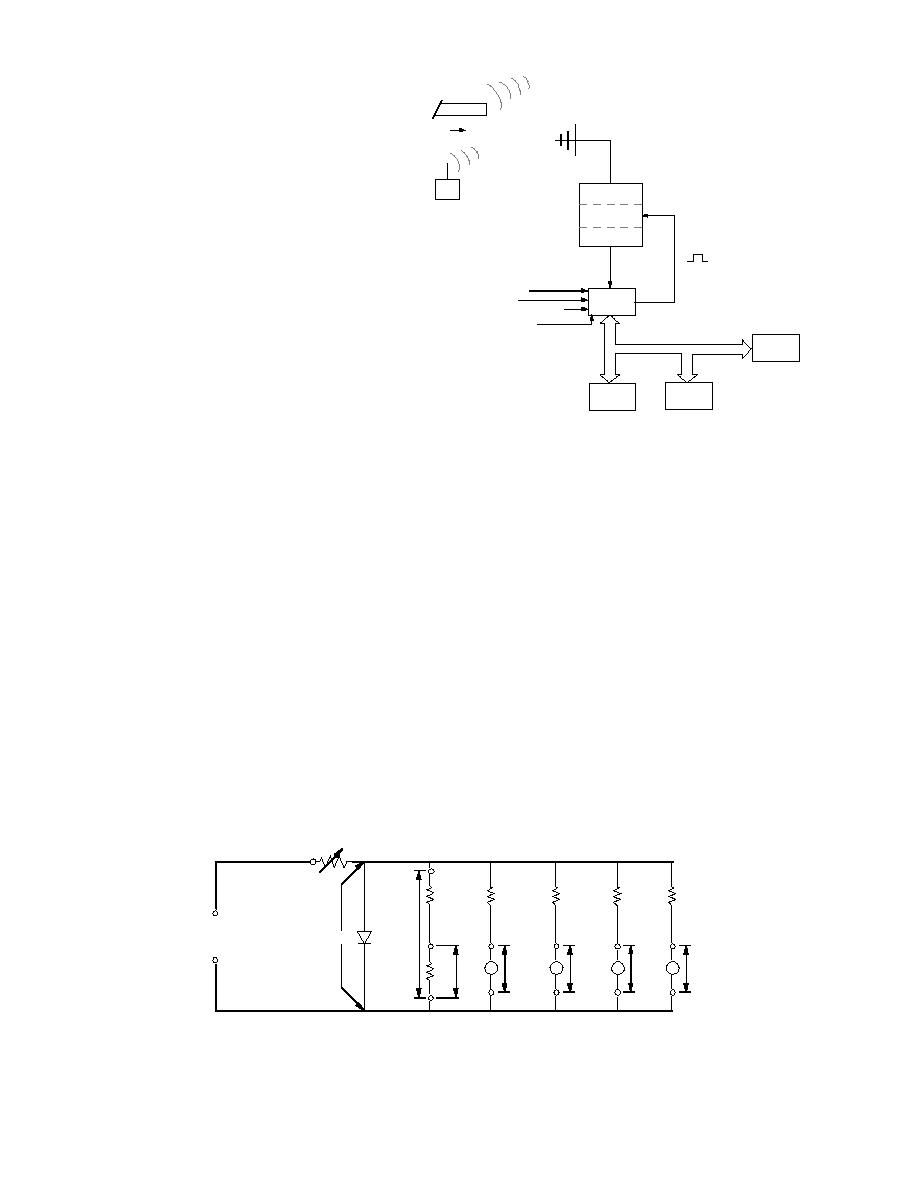
Figure 14. Data acquisition system used for monitoring the
tervals. Accurate field measurements of the
scour instruments.
air and water temperatures can provide
insight into the production and accumula-
1/T = A + BlnR + C(lnR)3
(1)
tion of frazil ice. These ice crystals are generated
in fast-moving water at low air and water tem-
where T = temperature (K)
peratures, and the frazil accumulations will af-
R = resistance reading of the thermistor
fect river hydraulics. To minimize the precision
A,B,C = curve-fitting constants.
error, the change in the thermistor resistance, which
is on the order of 6000 ohms, was read indirectly
The coefficients A, B and C are determined by the
by measuring the voltage drop across the ther-
manufacturer for each thermistor by calibrating
the thermistors at three points bracketing 0C
mistor (Fig. 15). This approach avoids the prob-
lem of detecting a small change in resistance us-
(YSI 1977).
This indirect measurement technique provides
ing a large range, dictated by the 6000 ohms full
a 0.01C accuracy on the temperature measure-
scale. Thermistor resistance is calculated by di-
ments. Two thermistor probes (Clark 1989 ) were
viding the voltage drop across the thermistor by
attached to a cage placed in the channel adjacent
the circuit current. To minimize the errors intro-
to the near-shore pier (Fig. 8). For redundancy,
duced by fluctuation in the circuit current, this
each probe had two thermistors of which one
current is calculated by dividing the measured
was read by the data acquisition system.
voltage drop across the precision resistor by the
A 6-psi pressure transducer attached to the
value of the precision resistor. The calculated
downstream end of the pier was used to monitor
thermistor's resistance is then converted to tem-
water levels. The transducer was a 350-ohm strain
perature using the SteinhartHart equation:
2k
2k
10k
10k
10k
10k
Vishay Amp
0.65V
Vf
1-2 Volts
T
T
T
T
VT
VT
VT1
VT4
2k
Vck
2
3
Figure 15. Thermistor string schematic.
10


 Previous Page
