electrical noise or electrical drift were documented
periods when scour is most likely to occur. This
to assure that no artificial loads were introduced
dictates that the instrumentation be robust and
into the recorded data. One potential source is
capable of withstanding impact from ice and de-
common mode noise (electromagnetic interfer-
bris, yet be nonintrusive or "affect" the erosion
ence, or EMI) being picked up by the 500-ft in-
process. For true versatility the instrumentation
strumentation trunk cable that connects the in-
has to be independent of a structure for either
struments on the pier with the onshore DAS. To
support or running instrumentation cables. Ide-
quantify line noise, a star bridge (Stein 1981)
ally, scour instrumentation would be installed at
(Fig. 10) was installed as a representative chan-
several locations to quantify scour due to chan-
nel starting at the junction box on the bridge. The
nel constriction, localized abutment scour and
four 350-ohm resistors used to build the star bridge
general bed erosion during flooding and icing
have the same electrical characteristics as a Wheat-
events.
stone bridge, therefore the same amplifier re-
sponse. But with one leg of the four-arm bridge
Scour instrumentation
tied in the center, the bridge has zero output.
The technique being developed is based on
Any measured signal is artificial and action can
radio transmitters used to monitor wildlife move-
be taken to eliminate the problem. Another pos-
ment. Being wireless, the active sensors can be
sible source of an artificial load is the drift of the
located independently of structures. Hence, critical
amplifier 's electrical zero balance and a change
elements, i.e., footings, pipelines etc., can be moni-
in the amplifier 's gain. Fluctuation of the zero
tored for scour. Each transmitter has a unique
translates into an artificial fixed load or shifts the
frequency with a superimposed timing pulse. If
intercept of the linear conversion equation. Am-
the transmitter is moving, the timing-pulse rate
plifier zero was monitored by shorting the input
is fast compared to when the transmitter is sta-
to the amplifier. A change in amplifier gain is
tionary. For mechanical protection, the radio trans-
similar to changing the slope of the linear con-
mitter is enclosed in a polyethylene housing ("in-
version equation. Enabling a resistor in parallel
strumented fish") as shown in Figure 11. The
with one bridge arm or a shunt, caused a shift in
concept is to tether a series of these transmitters
the amplifier 's output. The operation of short
to a vertical mast buried in the riverbed (Fig. 12).
and shunt relays were controlled by a digital
On the rising limb of a hydrograph, as the sed
output from the HP 3421. Amplifier checks were
iment is eroded, successive instrumented fish
conducted prior to opening each 50-point data
would be exposed to the current. The front fin of
file and at a preset time daily. The daily short
the housing encourages movement of the fish,
and shunt calibrations were also recorded on the
changing the timing-pulse rate of the transmit-
tape recorder as a calibration signal.
ter, which is monitored continuously. With the
By monitoring the analog instrumentation per-
current fish design the water velocity has to be in
formance, any electrical variation that would oth-
excess of 4 in./s to trip the activity switch. On the
erwise appear as an artificial load is taken into
account. Accounting for the precision and bias
error reduces the uncertainty in the load mea-
surements.
Erosion and scour instrumentation
Techniques for documenting bed erosion and/
or scour vary from simple bottom surface pro-
files with sounding lines, to elaborate geophysi-
cal density profiling. The bottom surface profiles
are typically documented after a flood or ice event,
and thus the physical processes cannot be corre-
lated to a hydrograph. An objective of this re-
search is to develop real-time scour monitors,
enabling correlation between the scour process
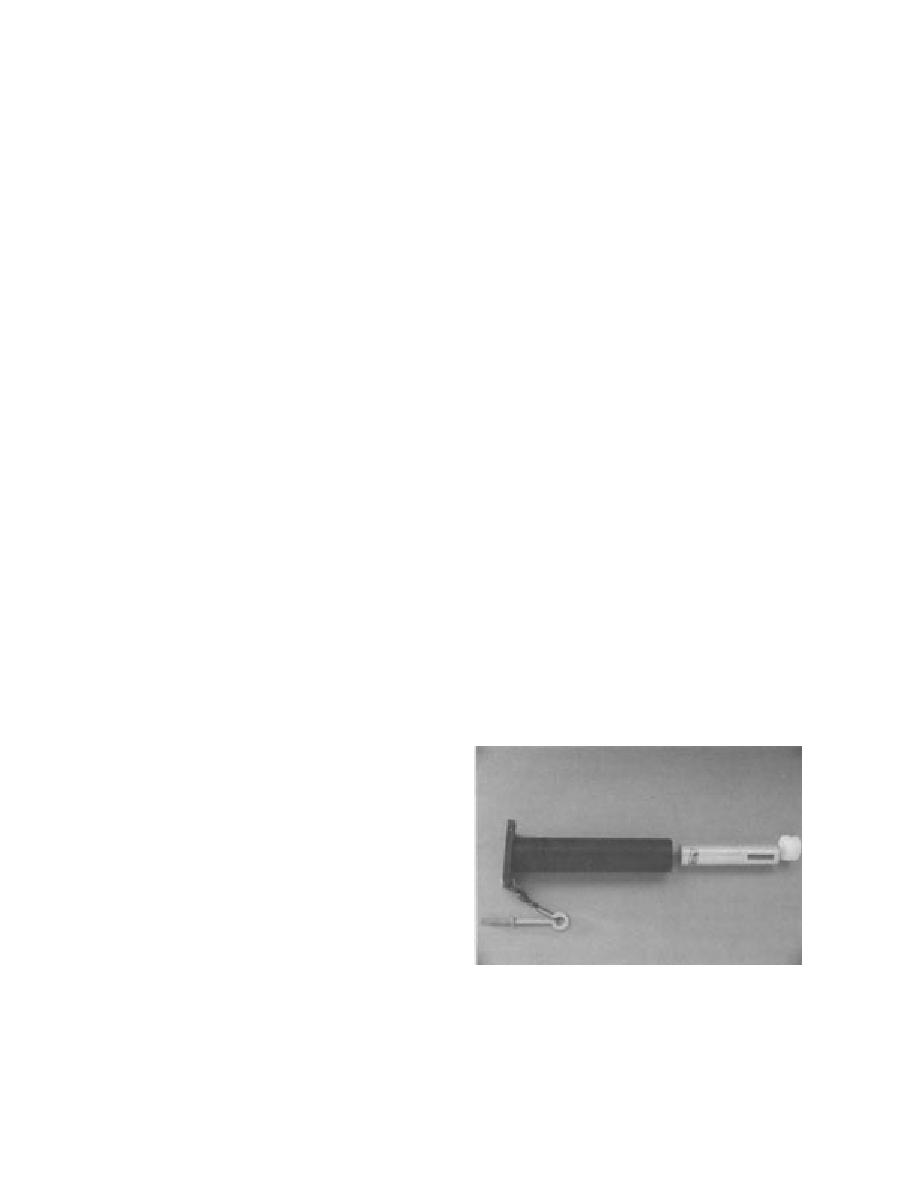
Figure 11. Assembly of the instrumented fish, includ-
and the hydrograph. It is critical that the instru-
ing an eyebolt, a swivel, a polyethylene housing, a
mentation perform during breakup and ice-jam
transmitter and an end cap.
8


 Previous Page
