5
4
3
CHNL INFLOW 5
2
1
CHNTFLUTFLW 5
OU L OOW 5
0
50
100
150
Time (h)
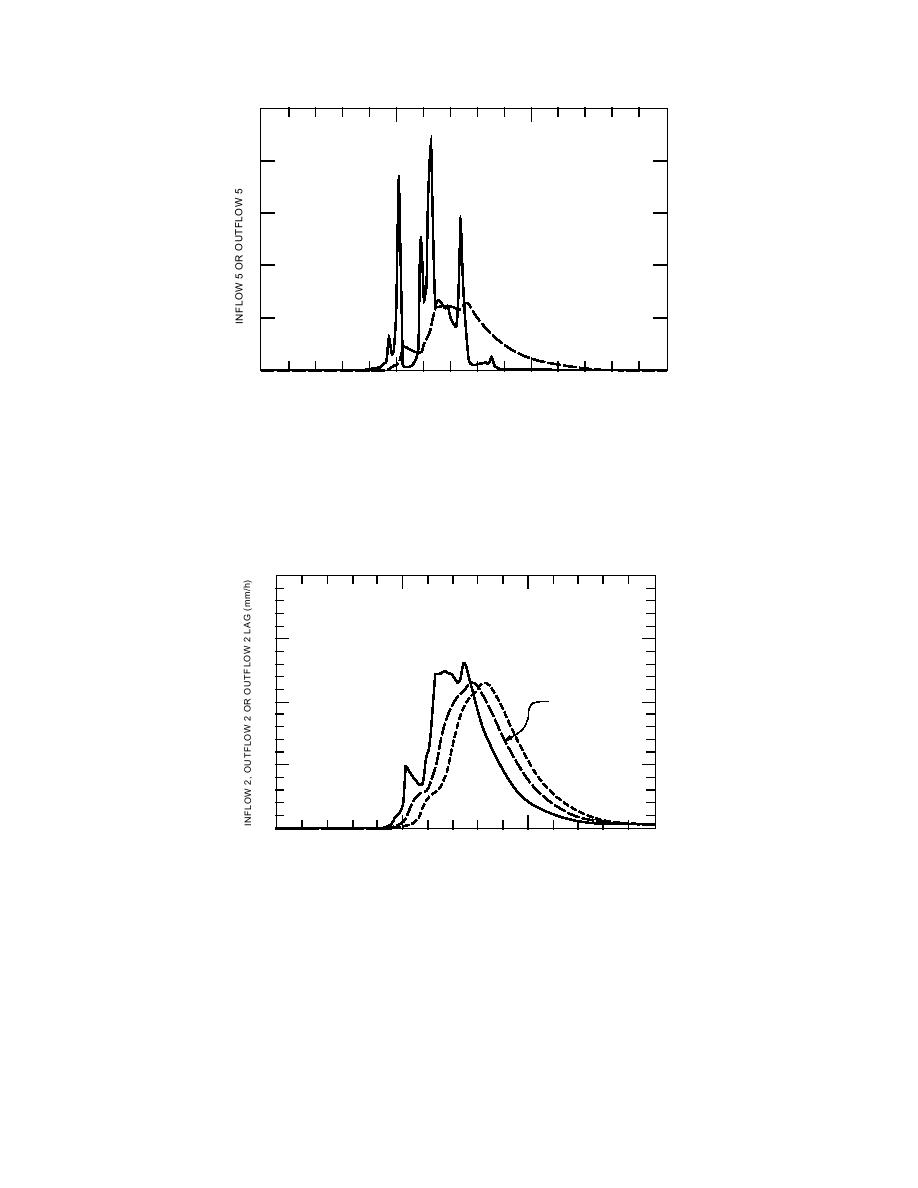
Figure 22. Lag created by a linear reservoir. INFLOW_5 peaks shortly after
60 hours while OUTFLOW_5 peaks near 75 hours. The difference in peak time
shows the lag created by the linear reservoir in that the inflow to the linear
reservoir (INFLOW_5) peaks before the outflow from the linear reservoir
(OUTFLOW_5). Furthermore, OUTFLOW_5 is much smoother than IN-
FLOW_5. The difference in smoothness is due to the storage of water within and
gradual release of water from the linear reservoir.
2.0
1.5
INFLOW 2
OUTFLOW 2
1.0
OUTF W 2
OUTFL 2 LAG LAG
OUTFLOW 2
0.5
0
50
100
150
Time (h)
Figure 23. Behavior of the lag and route structure. INFLOW_2 peaks at
75 hours, OUTFLOW_2 peaks at 79 hours, and OUTFLOW_2_LAG peaks
at 84 hours. The difference in peak times among INFLOW_2, OUT-
FLOW_2, and OUTFLOW_2_LAG shows the effect of the lags located in
the lag and route structure because INFLOW_2 is the inflow to the linear
reservoir in the lag and route structure, OUTFLOW_2 is the lagged outflow
from the linear reservoir in the lag and route structure, and
OUTFLOW_2_LAG is OUTFLOW_2 lagged by three hours. The difference
in smoothness between INFLOW_2 and OUTFLOW_2 is due to the storage
of water within and gradual release of water from the linear reservoir in the
lag and route structure. The similarity in smoothness between OUT-
FLOW_2 and OUTFLOW_2_LAG is because OUTFLOW_2_LAG is the
value of OUTFLOW_2 delayed by three hours.
35


 Previous Page
