1080
1075
1070
1065
1060
1055
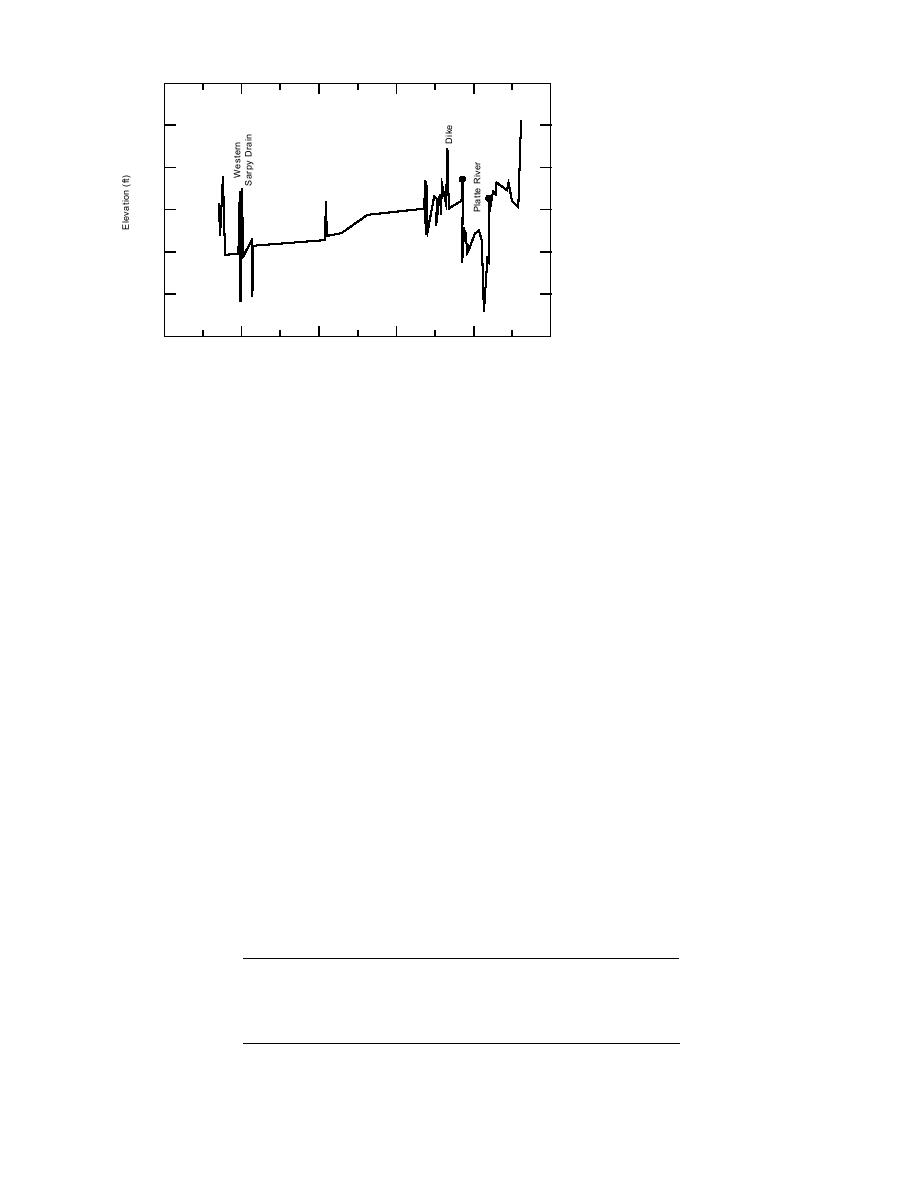
Figure 11. Typical Platte River par-
tial valley cross section upstream of
1050
20 x 10 3
0
4
8
12
16
Highway 6 in Sarpy County.
Distance (ft)
stream to near the DouglasSarpy County line.
cussion of results is qualitative, reflecting the un-
The HEC-2 model was developed from available
certainty found in the model. Figure 11 shows a
HEC-2 input used for an ongoing Platte River
typical cross section between the Elkhorn River
floodplain study performed by R. Michael Bren-
confluence and Highway 6 that illustrates why
neman for the Nebraska NRC. Conditions mod-
floods are so damaging below the Elkhorn conflu-
eled included open-water, freeze-up, stable ice
ence. The overbank near the Western Sarpy Drain
cover and breakup. Discharges used were ap-
is up to 5 ft lower than the Platte River high bank
proximately equal to the 50%, 25% and 1% sea-
and as much as 10 ft lower than the top of the
sonal flow duration values shown in Table 12 for
levee along the river. Once the levee is overtopped
open-water, freeze-up and stable ice-cover pro-
or breached, it is evident that the depth of water
files and the 1% seasonal flow duration value for
in the overbank can be quite large.
the breakup profile. ICETHK was used in con-
The thickest accumulations of ice shown in the
junction with HEC-2 for the freeze-up and break-
model correspond closely to observed ice-jam
up profiles. Plots of the modeled profiles are
locations. The most noticeable areas of ice accu-
shown in Appendix B.
mulation were immediately downstream of the
Some problems were encountered with the
Highway 6 bridge, near the north end of Camp
HEC-2 input data. The numerous geometry errors
Ashland and north of Thomas Lakes. Ice thick-
found in the model, especially at bridges, required
nesses modeled for the 1% duration flow exceed-
correction before the model would run properly.
ed 3 ft for freeze-up and 5 ft for breakup. Howev-
Some cross sections had channel and valley di-
er, not enough field data are available to verify
mensions that did not correspond well with the
the thickness and locations. The profiles for open
location shown on the maps provided. Other cross
water and stable ice cover show localized decreas-
sections had detailed survey information within
es in water surface slope near each of these three
the channel, while others had only two points
locations, but greater decreases were modeled just
below the bank line. As a result the following dis-
upstream of the Elkhorn and just upstream of Salt
Table 12. Discharges used in HEC-2 model of lower Platte River.
50% exceedance
25% exceedance
1% exceedance
discharge
discharge
discharge
Location
(cfs)
(cfs)
(cfs)
Platte River downstream
4500
8000
12000
of Elkhorn River
Platte River upstream
3500
6000
9000
of Elkhorn River
22


 Previous Page
