2
2
1
1
0
20 x 102
0
4
8
12
16
60 x 103
20
40
Maximum AFDD
Maximum Discharge (cfs)
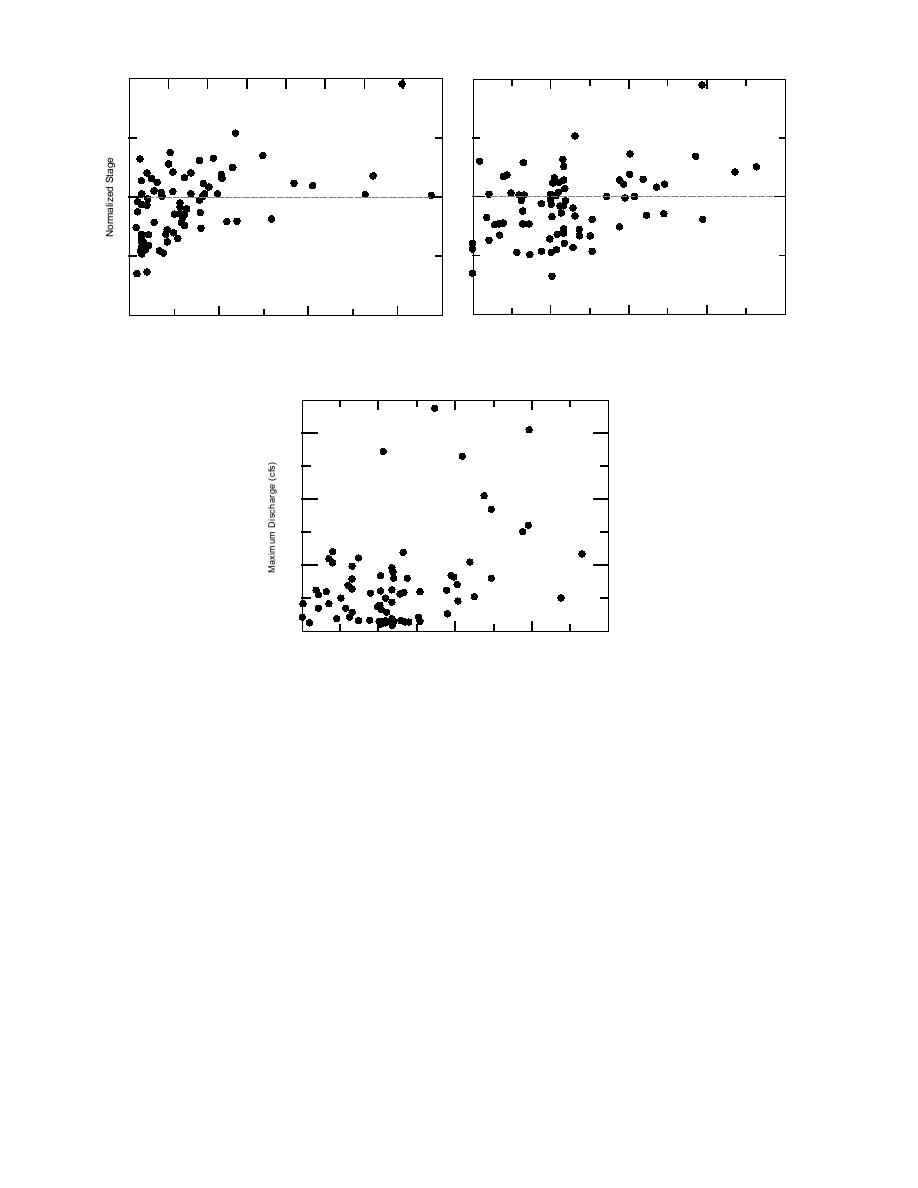
a. Normalized stage vs. maximum discharge.
b. Normalized stage vs. maximum AFDD.
60 x 103
40
20
0
2
4
8
12
16
20 x 10
Maximum AFDD
c. Maximum discharge vs. maximum AFDD.
Figure 9. Relationships among normalized stage, maximum discharge and maximum AFDD for January through
March, water years 1950 through 1990.
after the weather begins to warm. Ice events oc-
events occur after the weather begins warming.
cur before the maximum AFDD 42% of the time,
For values close to zero, the maximum stage oc-
but 64% of these events are below flood stage.
curs near the time of the maximum AFDD, when
Although not documented, it is possible that some
the ice would be thick, competent and most likely
of the earlier events, say those occurring prior to
to cause a damaging ice jam. However, the data
JD 100 (8 January), may be freeze-up events rath-
show that flood events (normalized stage greater
er than breakup events. In addition, ice events
than 1) occur both before and after this date. Again,
that occur before the maximum AFDD may also
values much lower than zero may indicate freeze-
have lower discharges, as snowmelt will not be a
up jams.
significant component of the discharge. Figure 10c
Ice events in the study area occur between late
presents the same data in another fashion. In this
December and late March, with ice events occur-
figure the normalized stage is plotted against the
ring most frequently between about 15 February
difference between the dates of the maximum
and 1 March. However, ice jams with significant
stage and the maximum AFDD. Negative values
flood stages have occurred as early as late De-
indicate that ice events occur before the maxi-
cember and as late as the end of March. Ice events
mum cold, and positive values indicate that ice
most commonly cause stages within the range
19


 Previous Page
