calibration. A water content of 25% will give a
0.8
reasonable value while being at the least sensitive
part of the curve. Thus, small measurement errors
that may occur under adverse field conditions
0.6
4 g/mL Picrate
would not have large effects on calculated results.
Potential interferences
0.4
Three environmental transformation products
of TNT that produce yellow acetone extracts are
3,5-DNA, 2ADNT and 4ADNT. Maximum re-
28 g/mL Humic Acid
0.2
ported concentrations of these chemicals in explo-
sives-contaminated soils (373 g/g for 2ADNT
and 14 g/g for 3,5-DNA) were obtained from a
0
report documenting analytical results for a num-
360
460
560
ber of soil samples from explosives-contaminated
sites in the U.S. (Walsh et al. 1993). When these
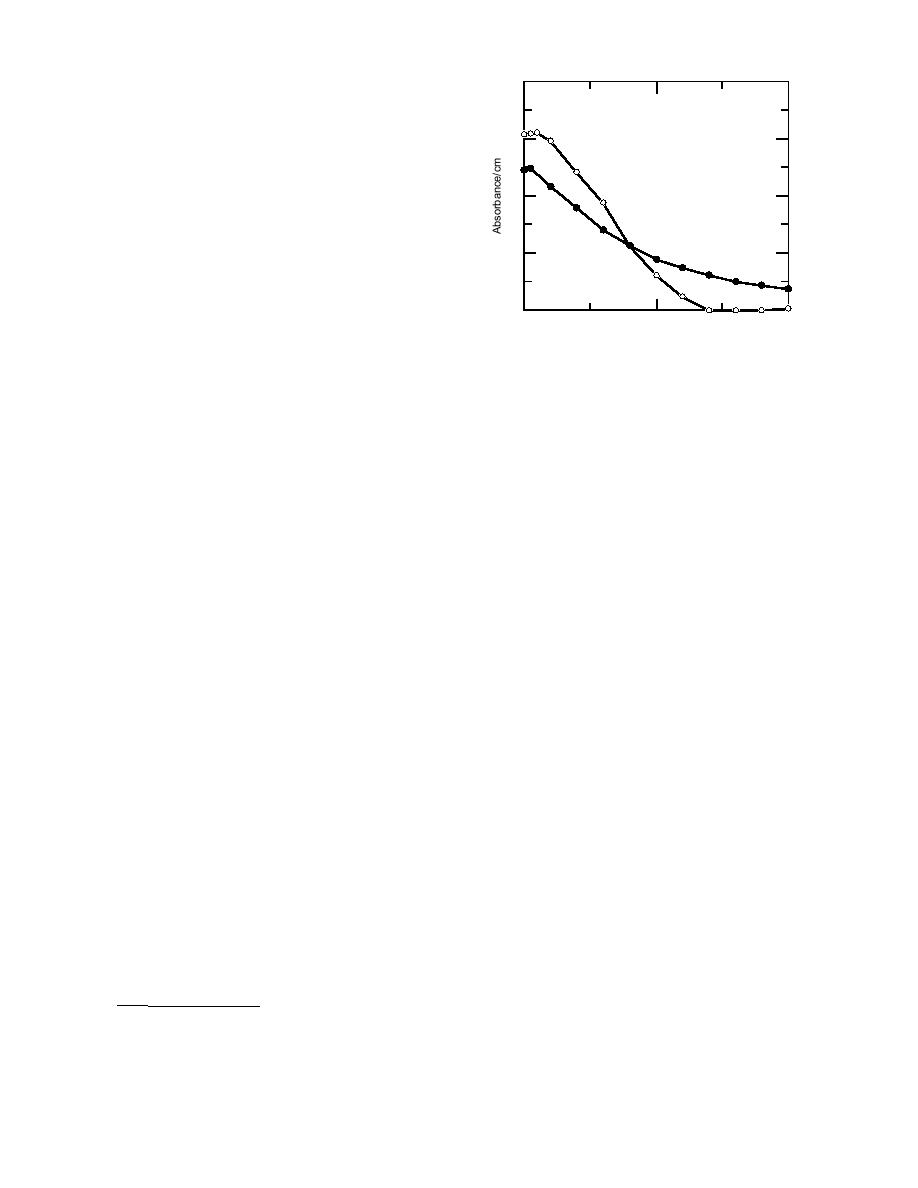
Figure 6. Absorbance curves for humic acid and
chemicals in an acetonewater solution at concen-
picrate ion in 75% acetoneH2SO4.
trations above the maximum reported levels were
extracted with an Alumina-A cartridge, the yel-
low color was retained on the sorbant. A rinse with
humic materials by 25%. It was decided that a 50%
3 mL of methanol removed all traces of the color.
reduction in interfering absorbances would pro-
An additional rinse with 3 mL of acetone removed
duce a more reliable correction factor. This could
the methanol and returned the cartridge to the
be achieved by adding 5 mL of unacidified ac-
original extraction conditions, ready for the elu-
etone followed by 5 mL of water to the 10 mL of
tion step. When subsequent eluents were analyzed
acidic eluent (producing a 20-mL mixture of 25%
by RP-HPLC, none of these analytes were detected.
aqueous acetone). The absorbance of the initial 10
Thus these compounds do not interfere in this
mL of eluent is divided by the factor-of-two dilu-
method.
tion and subtracted from the final absorbance of
Another source of yellow in acetone soil ex-
the 20 mL of acetonewater mixture.
tracts is elemental sulfur.* The yellow color from a
This background scheme also provides an im-
sulfurous acetone extract from an anaerobic Eagle
portant confirmation step to the method. The ad-
River Flats, Alaska, sediment was not retained on
dition of 5 mL of unacidified acetone will cause a
Alumina-A.
visible decrease in the absorbance of colored elu-
The presence of humic materials in soil extracts
ents. The subsequent addition of 5 mL of water
was found to be a problem because these com-
will then cause a visible increase in yellow if picrate
pounds are also highly colored acids which are
is present.
retained by acidic ion exchangers. Some humic
substances were eluted along with the picrate. The
Method detection limit
quantity of eluted humic color was highly vari-
To establish the method detection limit (MDL)
able (from 14 to 45% of the applied material) and
(USEPA 1984) for this method, a locally acquired
absorbed strongly in the 400-nm region, where
sand was fortified by adding aqueous picrate so-
picrate absorbance is at its maximum for the
lutions to the air-dried soil such that the resulting
HACH spectrophotometer (Fig. 6). However, since
moisture content was 10%. A standard curve was
the development of the picrate color requires a
constructed by processing 22-g samples that had
dilution of the eluent with water, a background cor-
been fortified with a range of picrate concentra-
rection scheme was used. As previously optimized,
tions plus a blank sample. The curve that was cal-
3.3 mL of water was needed to maximize the yel-
culated using a standard regression model had a
low color of the diluted 10 mL of eluent (produc-
very small, non-zero intercept. If absorbance read-
ing a 13.3-mL mixture of 25% aqueousacetone).
ings were rounded to the nearest 0.01, this inter-
This dilution would reduce the absorbance of the
cept became insignificant. Resulting picrate val-
ues should be reported using two significant dig-
its. The quantity of picric acid based on a dry weight
of 20 g of soil, extracted with 100 mL of acetone
* M.E. Walsh, U.S. Army Cold Regions Research and
and quantified with a 1-cm path-length cell, was:
Engineering Laboratory, personal communication, 1994.
6


 Previous Page
