7
8
Formation Booms and Structures
30
Formation Weirs
23
Tension Weirs and Fence Booms
Lines and Nets
1
3
Pier Breakup Structures
6
5
Weir-and-pier Breakup Structures
20
4
22
19
18
2
10
11
20
12
13
10
21
24
9
17
14
15
16
0
2
4
6
8
Average Velocity (ft/s)
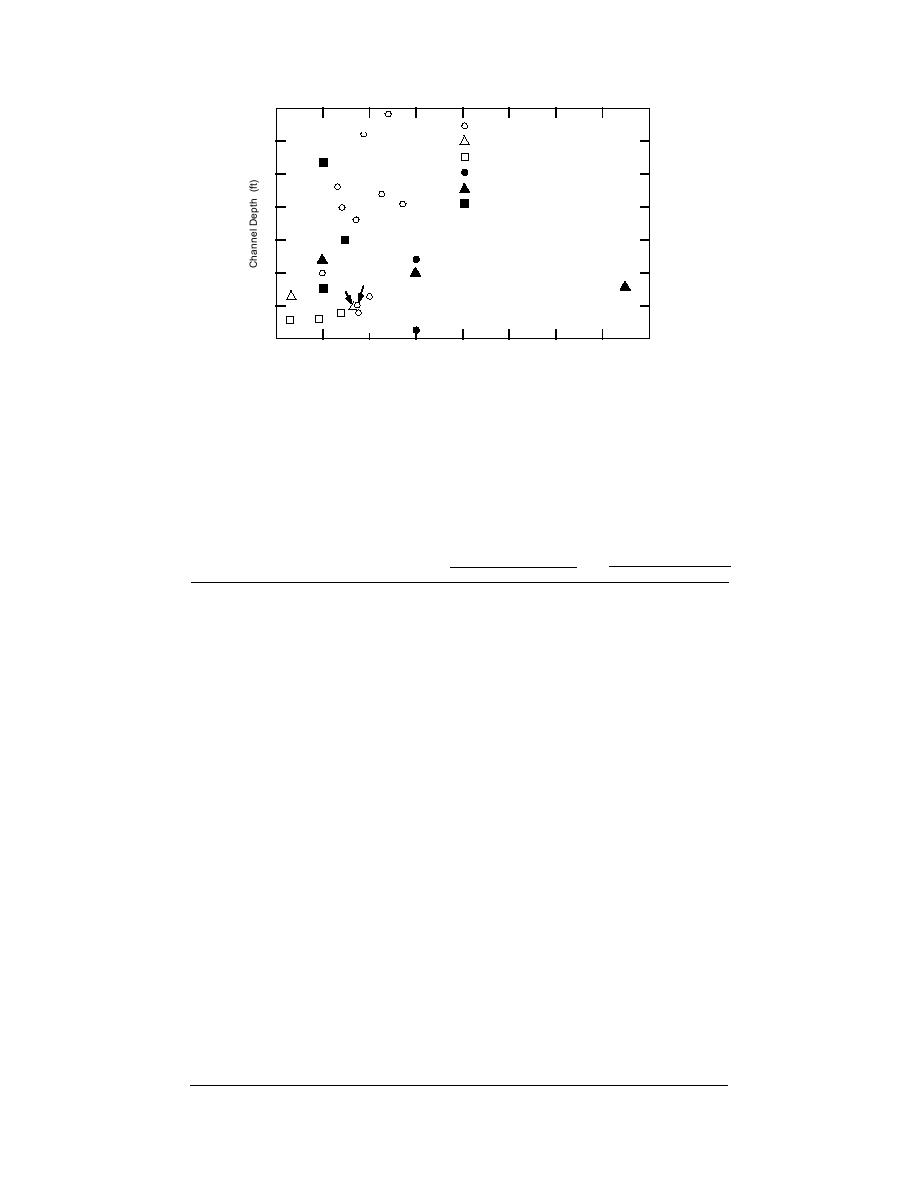
Figure 27. Depth vs. average velocity for various types of ice con-
trol structures. The numbers correspond to the list in Table 2.
45 ft for shallow poolriffle rivers to 45 ft for
The Montreal Harbor ICS and the Lake St. Peter
some booms on major waterways such as the St.
ice islands, with similar hydraulic conditions,
Lawrence. Slightly higher velocities are reported
fall into the same field as the formation booms.
for the St. Marys River boom, which retains pre-
Formation weirs, like booms, promote ice
dominantly brash and floes rather than frazil.
cover growth during freeze-up, and their veloc-
Table 2. Channel depth and water current velocity at selected structures.
Depth (ft)
Velocity (ft/s)
Structure
low
high
average
low
high
average
Formation booms and structures
1 Ice islands, Lake St. Peter
21
25
23
1
1.6
1.3
2 Booms at Lanoraie and Lavaltrie
10
1
3 Montreal Harbor ICS
22
2
2.5
2.25
4 Lake Erie boom
18
1.4
2
1.7
5 Lake St. Francis boom
20
1.4
6 St. Marys River boom
10
31
20.5
2.7
7 Beauharnois Canal booms
34
2.4
8 International Section booms
17
45
31
0.95
2.75
1.85
9 Salmon boom
2
6
4
1
2.5
1.75
10 Allegheny boom
6.4
2
11 North Platte boom
5
1.7
Formation weirs
12 Israel River weir
6.5
0.33
13 Oil Creek weir
5
1.5
1.8
1.65
Tension weirs and fence booms
14 Mascoma River fence boom
4.0
1.4
15 Japanese ice fence
3
0.9
16 Union Village tension weir
3
0.3
Lines and nets
17 Frazil collector lines
1
4
2.5
2.4
3.6
3
18 Swedish ice nets
12
3
Pier break-up
19 Credit River piers
12
1
20 Hardwick granite blocks
10
3
21 Mohawk River ice breakers
8
5
10
7.5
Weir and pier
22 St. Raymond weir with piers
15
1
2
1.5
23 Ice control dam at St. Georges
27
1
24 Narragaugus River structure
7.5
1
23


 Previous Page
