380
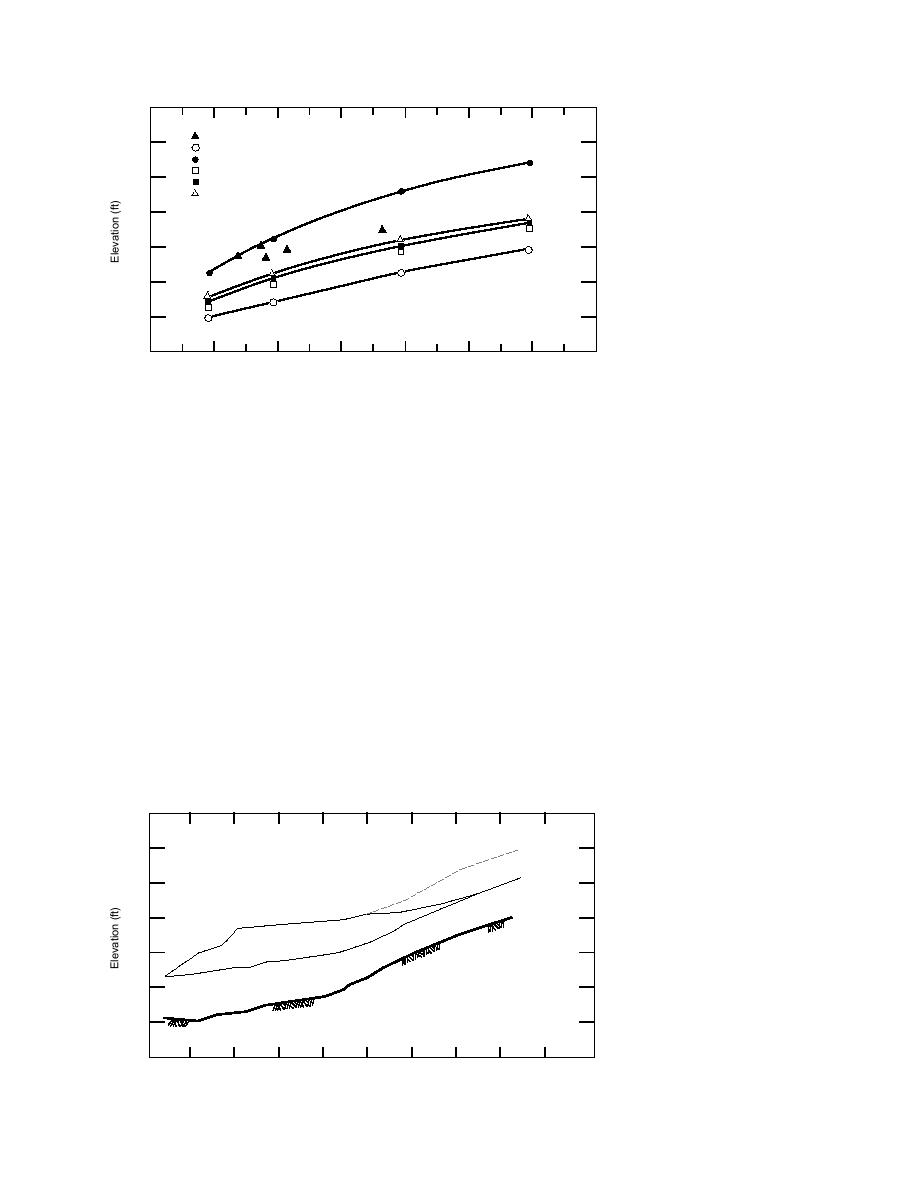
Actual Flood Levels
Open
Full
1 ft
370
2 ft
3 ft
Figure 12. Ice-affected rating
curves of the Aroostook River,
near Limestone Road bridge,
360
Fort Fairfield. Shown are the
flood levels reached during ice
jams in 1932, 1936, 1940, 1973
and 1976.
350
70 x 10 2
0
10
20
30
40
50
60
Discharge (ft 3 /s)
of 10,000 to 15,000 ft3/s, and would then in-
developed for river station 402+84, which corre-
sponds to the Limestone Road bridge. The
crease to levels no greater than the equilibrium
curves represent open water, ice-covered and
jam curve (depending on ice conditions and
ice-jammed conditions in order of increasing
supply).
stage. The figure shows the calculated ice-affect-
It must be reiterated that calculations assum-
ed water levels for discharges up to a 25-year
ing an equilibrium ice jam generate the maxi-
open water flood (60,000 ft3/s). It is unlikely,
mum possible water surface elevation for a giv-
however, that an ice cover would remain intact
en discharge. Actual water levels are most often
for discharges much greater than 10,000 ft3/s or
less. Lower actual water levels can be found at
that a jam would remain stable for discharges as
locations close to the toe of the jam where the
large as a 5-year open water flood (43,000 ft3/s).
jam may not be fully developed. If there are in-
For the major ice-related floods reviewed in
sufficient quantities of ice to form an equilibri-
Table 3, peak stages for all but one were reached
um jam, the actual water levels will also be low-
at discharges of no more than 23,000 ft3/s. The
er than computed. For example, the December
1973 ice jam was known to be only about 1/2
remaining flood, in 1976, had a discharge on the
order of 37,000 ft3/s. A 2-year flood is on the or-
mile long, and could thus affect only a relatively
der of 31,000 ft3/s. Prior to reaching a 5-year re-
short length of river.
currence interval discharge, it is likely that any
ice jam would release, and water levels would
Effect of Caribou's dam
return to open water levels. Thus, the true rating
It is possible that the dam in Caribou acts as
curve would likely follow the curve for an ice
an ice-retaining structure during breakup. If so,
cover of appropriate thickness up to a discharge
the supply of ice to the jam at Fort Fairfield
400
Full
Jam
380
Controlled
Open
360
Bed
Figure 13. Possible effect of the
Caribou dam as an ICS (Q =
20,000 ft3/s; hi = 28 in.).
340
1200 x 10 2
200
400
600
800
1000
Distance (ft)
18


 Previous Page
