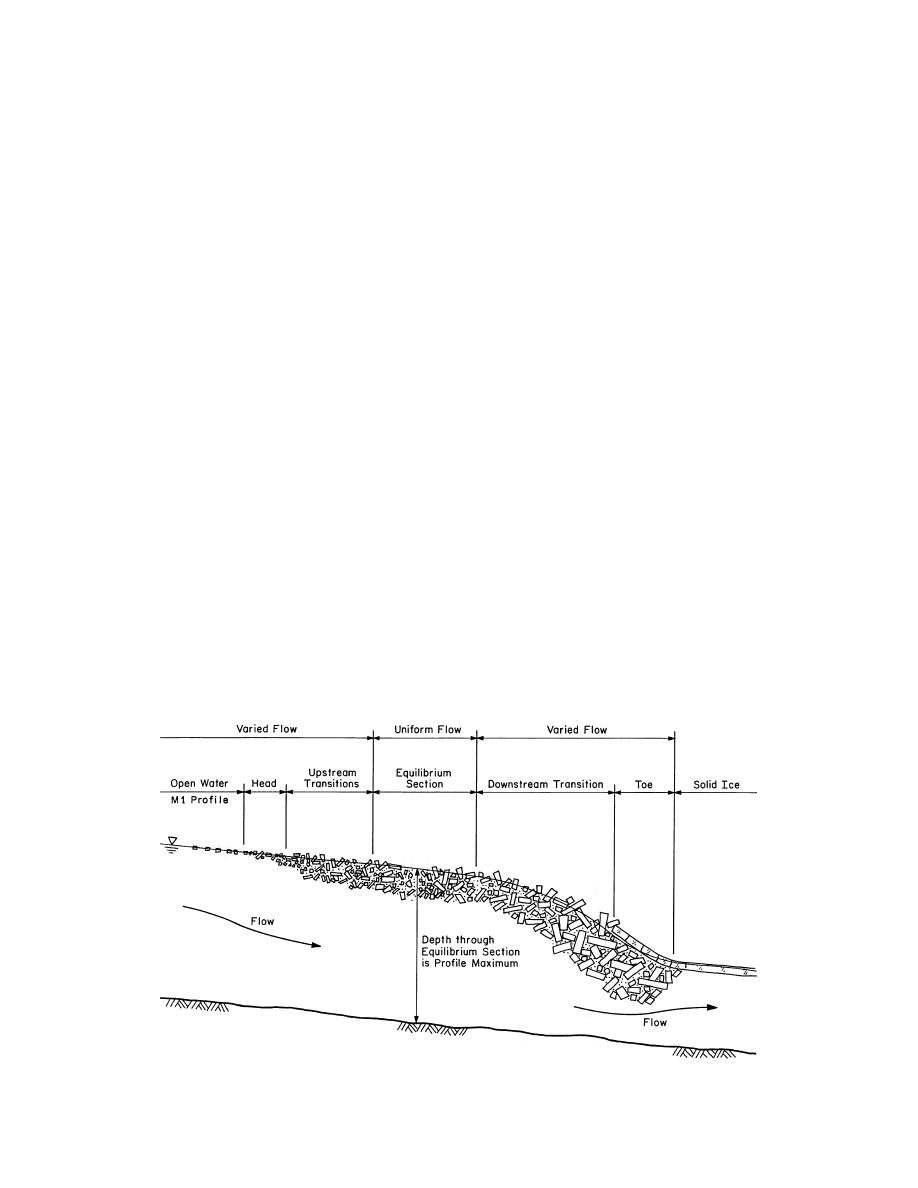
the upstream end, or head, of the jam, flow
PRELIMINARY EVALUATION OF AN
depth again makes a transition towards the low-
ICE-CONTROL STRUCTURE AT
er flow depths associated with the open water
FORT FAIRFIELD
conditions upstream. The longitudinal profile of
a typical fully developed breakup ice jam is
Ice-related flooding tends to be local and high-
shown in Figure 10.
ly site specific. Without sufficient prior field
Owing to the complex interaction of hydro-
observations, it is difficult to predict where jams
logical and meteorological conditions, it is very
will form along a river. However, most breakup
difficult to predict the occurrence, location and
jams are the result of ice moving downstream un-
severity of a breakup ice jam, even for areas
til it encounters a strong, intact downstream ice
known to be prone to jamming. Analysis is often
cover or other surface obstruction, or a significant
limited to estimating upper and lower limits of
reduction in water surface slope. At Fort Fair-
probable stages. If a jam is known (or assumed)
field, the Tinker Dam reservoir provides a rela-
to form at a given location, it is possible to esti-
tively quiescent body of water, with a water sur-
mate the maximum resulting flood levels. It can
face slope much milder than that of the river up-
be shown that for a given scenario of water dis-
stream. The Tinker Dam hydroelectric project is
charge and ice conditions, the maximum water
located 2 miles downstream of the U.S.Canadian
levels will occur within the equilibrium portion
border, and about 5 miles downstream of the
of the jam described earlier. Since ice and flow
Limestone Road bridge in Fort Fairfield. The res-
conditions are relatively uniform within the
equilibrium reach, it is a fairly simple matter to
project operates at a head of 85 ft. The river
estimate the water levels in this portion of the
above the dam has a fall of about 365 ft over a
jam. Depending on where a jam forms, and
length of 105 miles. During the ice breakup peri-
whether there is sufficient upstream ice dis-
od, ice entering the Tinker Dam pool from up-
charge to form a jam long enough to develop an
stream loses its impetus, stalls and accumulates.
equilibrium reach, actual water levels may be
At the downstream end, or toe, of the jam, the ice
less and the estimate will be conservative.
accumulation results in a gradually varied flow
Water surface profiles for the Aroostook Riv-
profile in the transition reach as water depth in-
er were calculated using the HEC2 computer
creases towards the deeper normal flow depth
program (USACE 1990). This analysis was based
associated with the thicker, rougher ice condi-
on a verified open water HEC2 data deck and
tions. If the jam is long enough, a fully developed
downstream rating curve prepared by NED per-
or equilibrium jam reach may form, in which ice
sonnel. The original deck provided to CRREL
and flow conditions are relatively uniform. From
Figure 10. Longitudinal profile of a typical breakup ice jam.
16


 Previous Page
