400
380
Water
Surface
Bottom
360
Ice
Bed
340
1200 x 10 2
200
400
600
800
1000
Distance (ft)
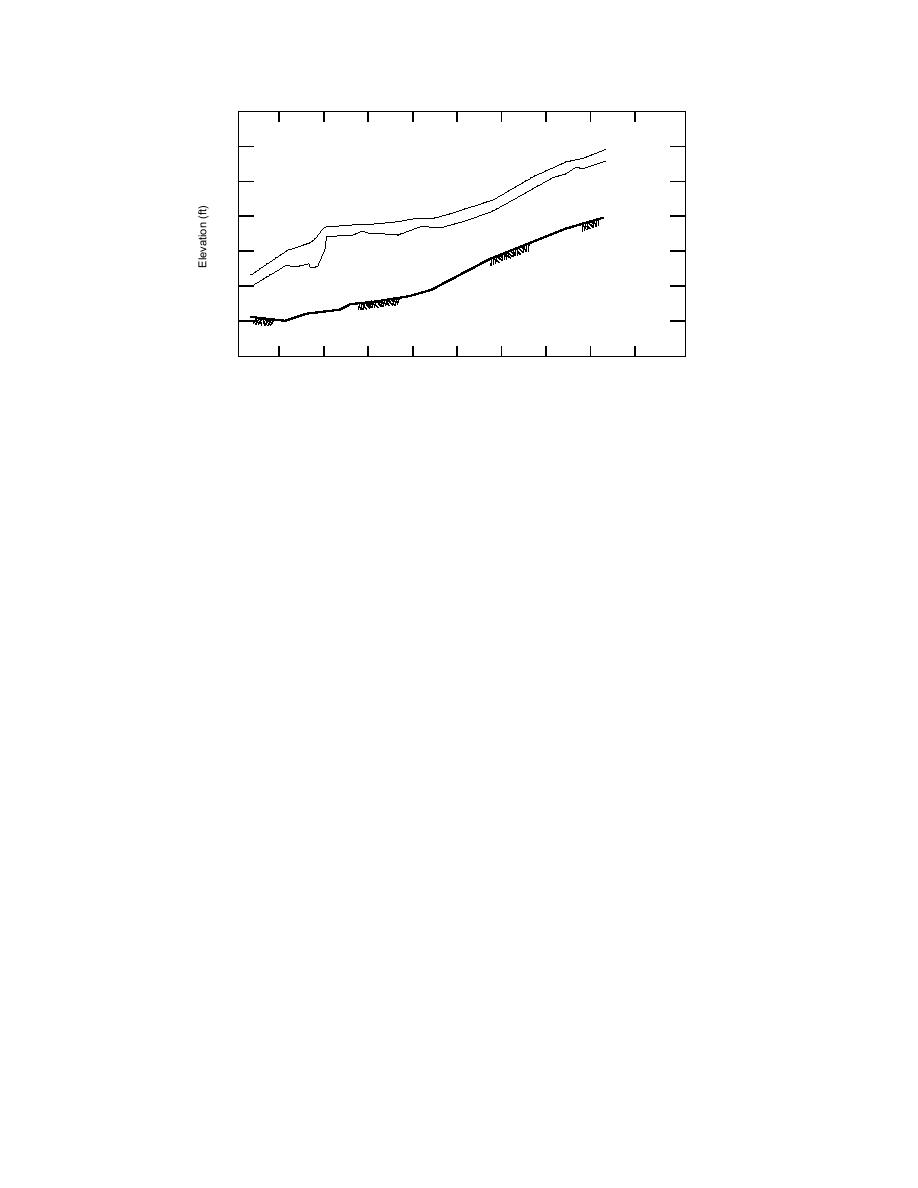
Figure 11. Water surface profile for an equilibrium ice jam on the Aroostook River
between Fort Fairfield and Caribou dam.
covered approximately 5 miles of the river,
calculate the water surface profile attributable to
extending from river station 236+54 at the U.S.
an equilibrium ice jam formed at a discharge of
20,000 ft3/s, assuming an unlimited ice supply, as
Canadian border to river station 490+70. This
original data deck was extended by CRREL to
shown in Figure 11. This constitutes the maxi-
river station 1034+00, which is just below the
mum ice-related stage possible for that discharge
dam in the town of Caribou, so that the relative
that was selected as being representative of the
effectiveness of alternative ice control options
Aroostook River flow at Fort Fairfield at breakup.
could be compared as described later. Cross-sec-
tion data for the extended deck were derived
Ice-affected water levels
from USGS 7.5-minute topographic maps. Man-
The first step in the analysis of ice-affected wa-
ning's n values were retained from the original
ter levels was a review of the significant ice jam
data deck. The extended portion of the data deck
floods described in an earlier section. For those
has not been verified against field data and
events, information was available on the date,
should be considered only approximate.
discharge and peak stage reached at the Lime-
The Limestone Road bridge in Fort Fairfield is
stone Road bridge. This information was used to
located at river station 402+84. Because the HEC
verify the performance of the HEC2 analysis us-
2 ice option is actually a modification of the stan-
ing the ice option. Lacking was information on
dard bridge option, ice cannot normally be simu-
the locations of the toe of the jams, jam thickness,
lated at cross sections where bridge code appears
length or ice volumes. Without field observations
in the data file. Two approaches may be used to
of the toe location, we had no alternative but to
overcome this problem. First, the ice cover may
assume that the ice cover throughout the river
be zeroed out for cross sections describing the
was fragmented and free to thicken into an equi-
bridge. Since bridge widths (in the direction of
librium jam in response to the forces imposed by
flow) are quite small relative to the river lengths
the flowing water. As described earlier, this as-
normally modeled with HEC2, the absence of
sumption would result in the maximum possible
ice in the bridge throat has a very local effect on
water levels for a given discharge. Actual water
the computed water surface profile. Except for
levels are almost always less and lie somewhere
the immediate vicinity of a bridge, the effect of
between the limiting conditions of open water, a
deleting the ice cover over such a short distance
solid cover of sheet ice, and a fully developed
is normally negligible. Another option is to de-
equilibrium ice jam. The solid ice cover case
lete the bridge from the simulation if the ice ef-
would represent the minimum ice-affected stage,
fects are determined to be of greater significance.
while the equilibrium ice jam case would repre-
For the Aroostook River, the bridge code was de-
sent the maximum stage possible for a given dis-
leted from the data deck.
charge.
The extended HEC2 data deck was used to
Figure 12 shows an ice-affected rating curve
17


 Previous Page
