250
Ti__e _days)
m _ (1 ___
_
200
2
3
150
5
1
_
0
100
50
0
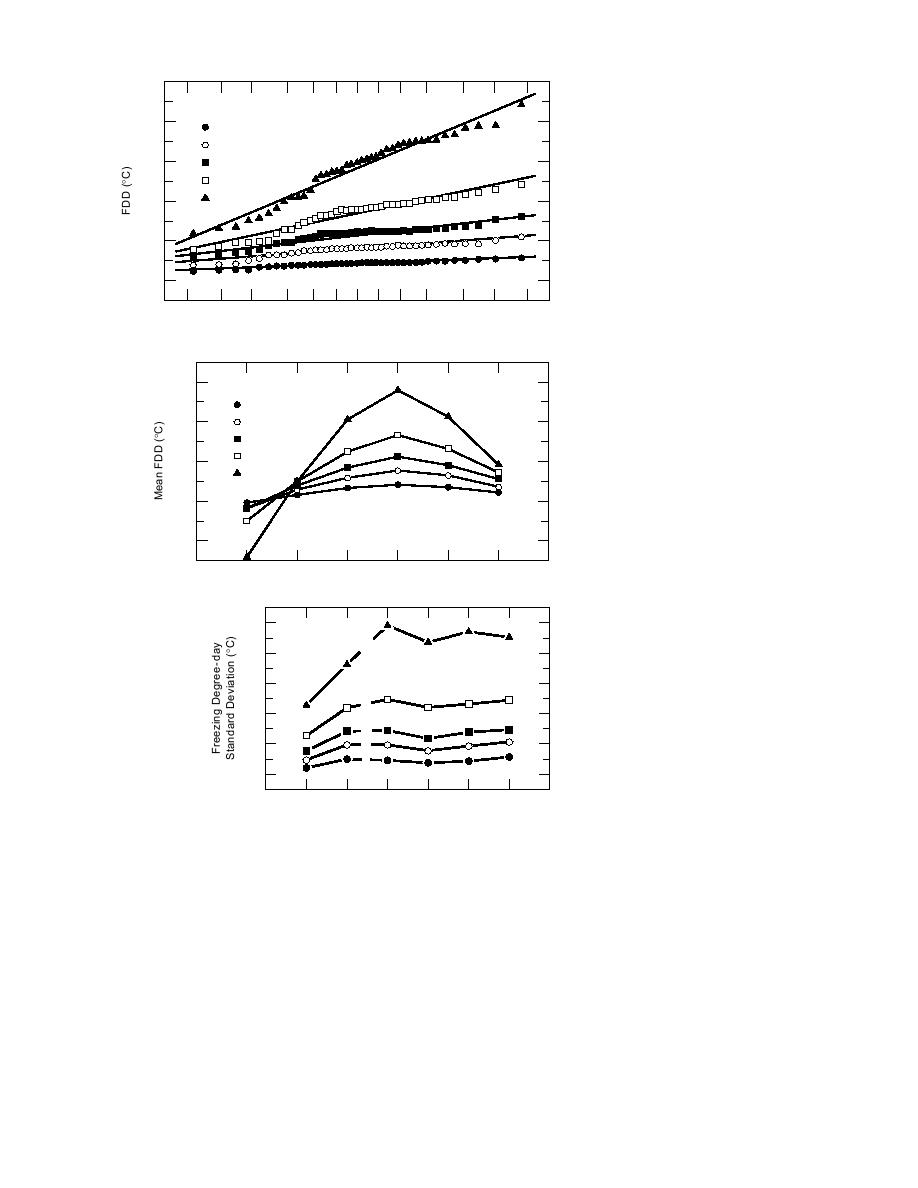
a. Freezing-degree-days exceedance
99 98
95
90
80 70 60 50 40 30 20
10
5
2
1
frequency distribution.
Exceedance Frequency Per Hundred Years
150
Ti__e _days)
m _ (1 ___
_
2
3
100
5
1
50
_
0
0
50
b. Monthly variation of mean FDD
for selected durations.
Oct
Nov
Dec
Jan
Feb
Mar
50
10 Days
40
30
5
20
3
10
2
1
0
c. FDD standard deviations for se-
lected durations.
Oct
Nov
Dec
Jan
Feb
Mar
Figure 8. Sample weather statistics, Yankton, S.D.
coefficient of 0.95 or greater. Therefore, in all cases
example, the particular values of mean and standard
FDDn can be said to follow a standard normal prob-
deviations for Yankton, S.D., are listed in Table 4 and
ability distribution function. This function is charac-
shown in Figure 8b and 8c. The mean FDD is a
terized by a mean and a standard deviation.
measure of the average severity of cold weather
The mean and standard deviations of FDDn for all
over the past 40 years, the period of record. The
stations, the six winter months, and the five selected
standard deviation represents a measure of the
durations (namely 1, 2, 3, 5, and 10 days) were then
fluctuation in weather conditions at a particular site
calculated by fitting a normal probability distribu-
during the 40 years of record. For example, from
tion function through the data. They are presented in
Table 4, it can be inferred that in January the coldest
tabular and graphical form in the appendix. As an
daily average temperature in the Yankton area will
9


 Previous Page
