60
St. Joseph
Kansas City, MO
1600
Haverly (MO)
Booneville
Hermann (MO)
1200
40
800
20
400
0
0
10
20
10
20
10
20
10
20
10
20
Nov
Dec
Jan
Feb
Mar
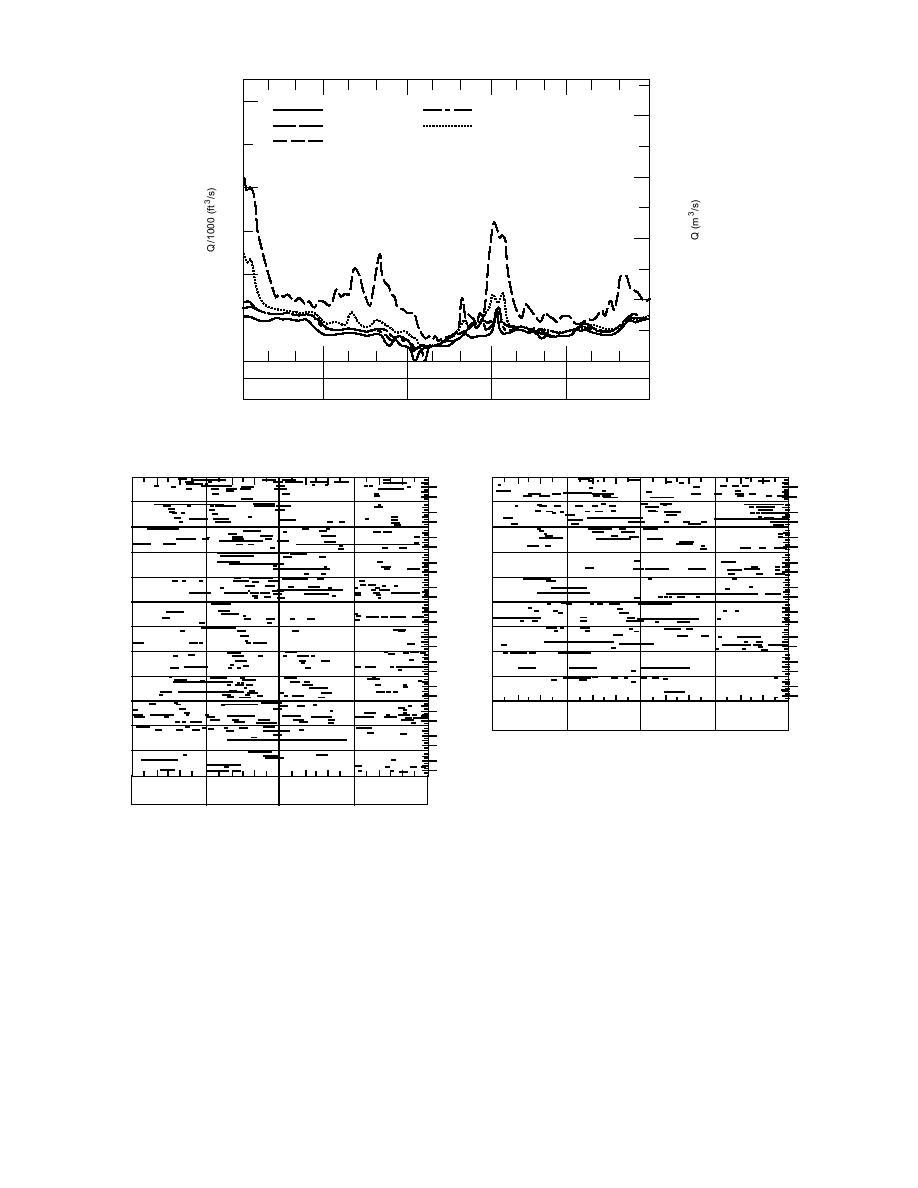
Figure 3 (cont'd). River discharge for winter of water year 1968.
Water
Water
Reach
Year
Reach
Year
2
2
4
4
1968
1980
6
6
8
8
2
2
4
4
'69
'81
6
6
8
8
2
2
4
4
'70
'82
6
6
8
8
2
2
4
4
'71
'83
6
6
8
8
2
2
4
4
'72
'84
6
6
8
8
2
2
4
4
'73
'85
6
6
8
8
2
2
4
4
'74
'86
6
6
8
8
2
2
4
4
'75
'87
6
6
8
8
2
2
4
4
'76
'88
6
6
8
8
2
10 20
10 20
10 20
10 20
4
'77
6
Dec
Jan
Feb
Mar
8
2
4
'78
6
8
2
4
'79
6
8
Figure 4. Depiction of ice events (by reach and water
10 20
10 20
10 20
10 20
Mar
Dec
Jan
Feb
year) identified during discharge analysis.
stations. For example, in reaches with few ice jam
indicate that decreases in discharge between
initiation points and those with a large incremental
Yankton and Sioux City can be traced downstream
drainage area, such as reaches 3 and 6, ice events
generally as far as St. Joseph. In some cases, the effect
would have to involve an extensive amount of water
of the initial dip can be traced farther (see December,
storage to cause a dip. As a result, this type of
water year 1969). It is difficult to distinguish the
discharge analysis is likely to underestimate the
effects of these "traveling dips" from intermediate
occurrence of ice events that cause localized de-
ice jams that occur simultaneously in downstream
creases in discharge, but is unlikely to predict an ice
reaches or later than the initial event.
event when none occurs.
The duration of the periods of decreasing dis-
Evaluation of ice event data
charge (dips) was plotted by water year for each
The number and location of ice events estimated
reach based on the discharge data (Fig. 4). These plots
using the two sources of data must be evaluated for
6


 Previous Page
