reliability. As noted previously, the num-
40
ber of ice events tabulated using the
Ice Sheets
Q
USGS gaging records may be underesti-
Records
mated in reaches with few jam initiation
30
points or with large incremental drain-
age areas. For example, reach 7 has the
smallest incremental drainage area
20
(2,000 square miles) and seven known
initiation points, so it will be likely to
show a high number of ice events by
analyzing discharge records. Reach 3 has
10
the largest incremental drainage area
(87,200 square miles) and only one
known jam initiation point and should
0
result in few ice events by analysis of
1968 '70
'72
'74
'76
'78
'80
'82
'84
'86
'88
discharge records. The ice data sheets
Water Year
may also underestimate ice events, par-
80
ticularly in the upstream reaches and
other locations where there are few ob-
Ice Sheets
Q
servation sites.
Records
60
Ice events have been recorded by both
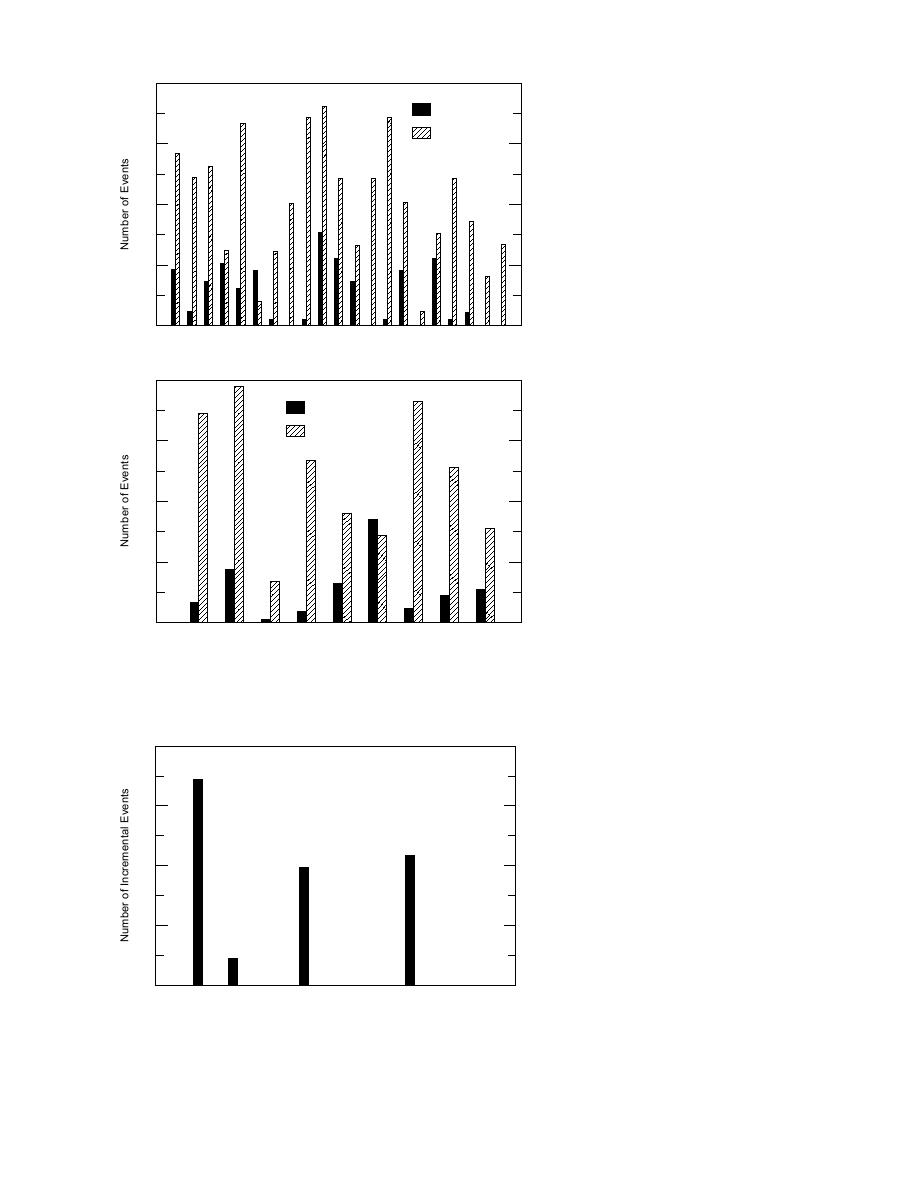
methods in all reaches (Fig. 5). The analysis
of discharge records resulted in a sub-
stantially larger number of ice events than
40
were recorded on the ice data sheets, except
in reach 6. The Atchison Bend jam, which
forms nearly every year in a highly visible
20
location, is largely responsible for the high
number of ice events in reach 6 recorded on
the ice data sheets. Reach 6 also has the
most detailed observations of the locations
0
1
2
3
4
5
6
7
8
9
of the upstream edge of the ice cover and is
Reach
probably the area of the most reliable data
Figure 5. Ice events recorded on MRD data sheets and by discharge
on the ice data sheets. Because of the dis-
analysis: a) all reaches by year and b) all years by reach.
parity in the number of ice events identified
by the two methods, it seems best to use the
ice data sheets for location of jam initiation
80
points, progression and regression rates,
and verification of the ice events identified
in the discharge analysis in easily observed
areas (such as reach 6).
60
The largest number of ice events re-
corded using the discharge records are in
reaches 2 and 7 and the least in reach 3.
40
Figure 6 shows the incremental increase in
the number of dips by reach; that is, the
amount by which the number of dips in a
20
particular reach exceeds that of the previ-
ous reach. This figure reveals that dips are
likely to initiate in reaches 1, 2, 4, and 7.
These reaches coincide with areas charac-
0
1
2
3
4
5
6
7
8
9
terized by low velocity during winter dis-
Reach
charge levels. As pointed out earlier, ice
Figure 6. Incremental increase in ice event by reach.
events occurring in reaches 1 and 2 present
7


 Previous Page
