Table 6. Intrusion volume at given pore diameter (m) and total intrusion volume.
<0.005 0.005 to 0.01 0.01 to 0.05 0.05 to 0.10 0.10 to 0.50 0.50 to 1.0 1.0 to 5.0
5.0 to 10.0 10.0 to 50.0
>50.0 Total
Sample
(%)
(%)
(%)
(%)
(%)
(%)
(%)
(%)
(%)
(%) (mL/g)
4205
8.6
16.4
28.9
15.0
15.3
3.9
5.9
0.5
3.7
1.8
0.0084
3632
11.4
15.4
27.2
6.3
9.7
3.6
8.1
5.9
11.2
1.2
0.0120
4206
8.2
10.6
29.8
14.1
14.4
17.6
1.9
0.3
2.0
1.1
0.0131
3791
6.8
9.0
35.6
14.2
28.3
2.7
1.0
0.2
1.4
0.8
0.0142
3666
5.2
7.2
16.1
15.3
34.7
5.2
8.1
1.6
4.8
1.9
0.0147
3593
6.3
9.2
47.9
26.6
6.2
0.3
0.2
0.0
2.2
1.1
0.0160
3704
7.3
8.2
14.3
7.1
21.7
5.6
19.4
8.2
6.3
1.9
0.0180
3595
4.0
4.5
8.2
2.5
44.7
24.4
9.8
0.2
1.1
0.7
0.0228
4204
7.1
6.4
7.3
3.5
10.4
5.3
15. 1
5.5
28.1
11.3
0.0498
4130
4.6
5.9
12.5
4.3
12.0
4.3
8.8
2.2
18.9
26.3
0.0618
were approximated at 480 dyn/cm and 140 respec-
sample to measure its pore volume between an
upper and lower limit of pore diameter. Since mer-
tively. Tests were conducted according to ASTM
cury is non-wetting, pressure is necessary to get
D4404 (ASTM 1984), except that the aggregates were
dried between 100 and 110C at atmospheric pres-
mercury into the pores. The pressure required to
overcome intrusion resistance is inversely propor-
sure.
tional to pore size according to the well-known
Tests were conducted on four pieces of aggregate
Washburn equation. In lieu of direct measurements,
from each sample subgroup. Values representative
mercury surface tension and contact wetting angles
of the entire sample were developed using weight-
0.0035
3593
0.0030
3595
3791
0.0025
4206
0.0020
0.0015
0.0010
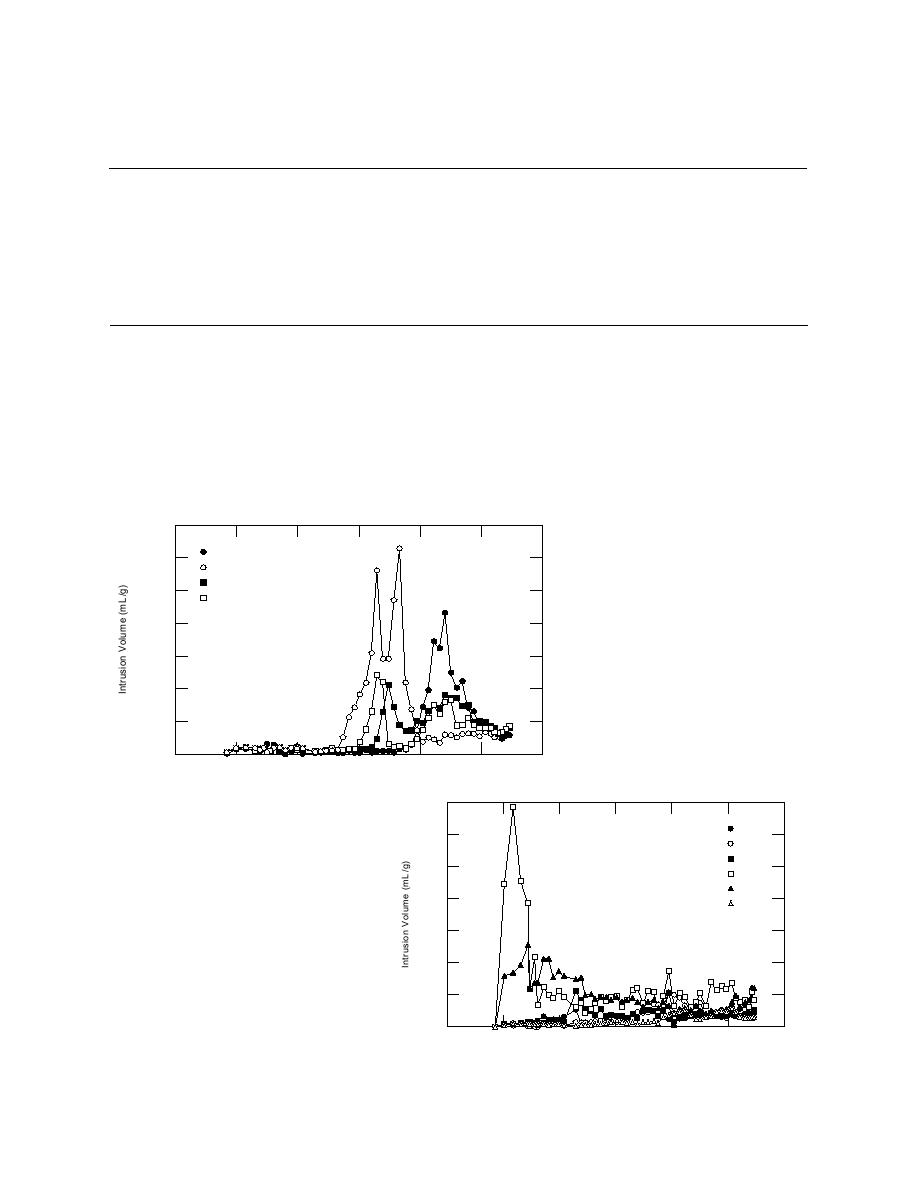
a. Four samples with most of the pore
volume below the 5-m diameter.
0.0005
0
1000
100
10
1
0.1
0.01
0.001
Diameter (m)
0.007
3632
0.006
3666
3704
0.005
4130
4204
0.004
4205
0.003
0.002
0.001
b. Six samples with more evenly distributed
pore volumes.
0
1000
100
10
1
0.1
0.01
0.001
Diameter (m)
Figure 2. Intrusion volume vs. pore diameter.
6


 Previous Page
