50
40
30
20
10
0
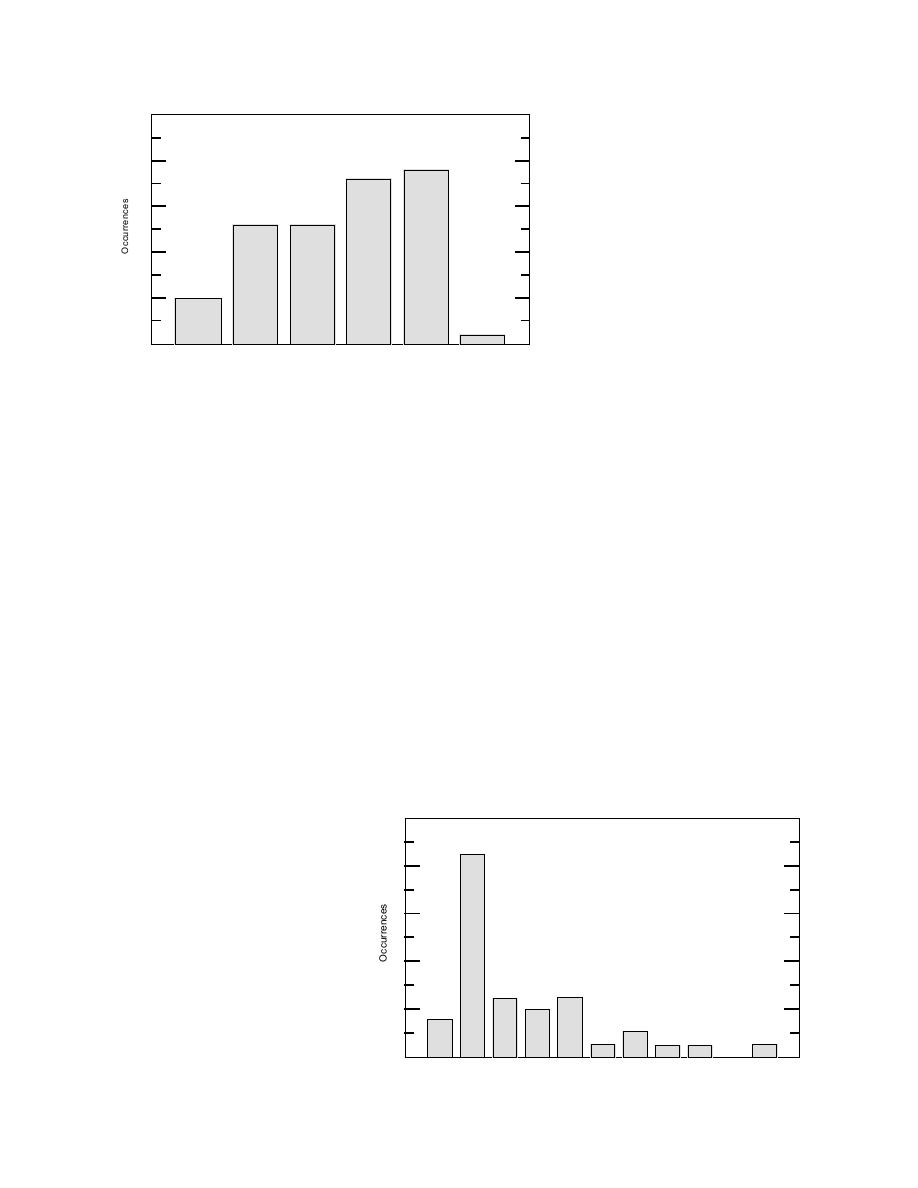
Figure 5. Histogram of failures by month.
Nov
Dec
Jan
Feb
Mar
Apr
widespread areas. Large storms in 1973, 1975, 1983,
occurred on the last day of that month in 1967, in a late-
and 1994 caused 48 of the 65 confirmed failures in those
spring storm of unusual intensity.
years. For example, the 1973 total of 12 failures was
In 40 cases, station personnel estimated the maximum
the result of three separate storms, but 10 towers fell in
distance that debris landed out from the tower base.
Kansas and Iowa during a single large storm in Decem-
Though they may have underestimated the distance to
ber. The worst year was 1983, for which I have record-
downplay the danger, the data show that when towers
ed 26 failures in three separate storms. Two storms, one
fall, the debris is usually contained within a radius of
in January and another in March, were responsible for
50% of the tower's height agl (Fig.6). The tensile strength
all but three of them. The January storm caused heavy,
of the guy cables relative to the bending strength of the
widespread damage and brought down 15 towers across
tower members usually ensures that the tower will fold
North and South Carolina, Alabama, and Mississippi.
into shorter segments as it falls. This is especially true
Seven more towers fell in North Dakota over a three-
for buckling failures due to massive ice accretion and
day period in March. One massive glaze ice storm was
low wind conditions. The mean and median collapse ra-
responsible for all 16 failures in 1994. The most storms
dii for the 40 cases were 31 and 20%, respectively, and
that caused collapses in any one year was four, causing
the standard deviation was 23%. Only six towers had a
seven towers to fall in 1989.
fall radius larger than 50%, and those were generally the
The `failure season' is December through March, as
result of unusual circumstances. For example, the 450-ft
can be seen in Figure 5. I have recorded 26 failures in
WKOX tower in Massachusetts reportedly jumped 5 ft
each of December and January, but February and March
off its base and laid out full length on the ground when
are the highest incidence months, each having about
80-mph winds caused the cable grips on an insulator to
37 failures. The relatively few November failures oc-
fail. Cable grips failed in several other cases but the tow-
curred throughout the month, whereas the two in April
ers always folded into a smaller radius. In the case of the
20
16
12
8
4
Figure 6. Histogram of collapse radius as a
0
10
20
30
40
50
60
70
80
90
100
110
percent of tower height.
Percent of Height
6


 Previous Page
