3
4
3
6
1
1
4
6
1
2
1
2
5
2
5
1
1
6
4
1
2
1
1
3
1
3
2
Tower Height
> 1000 ft.
-1
601 to 1000
-3
301 to 600
-9
< 301
Unknown Height
-1
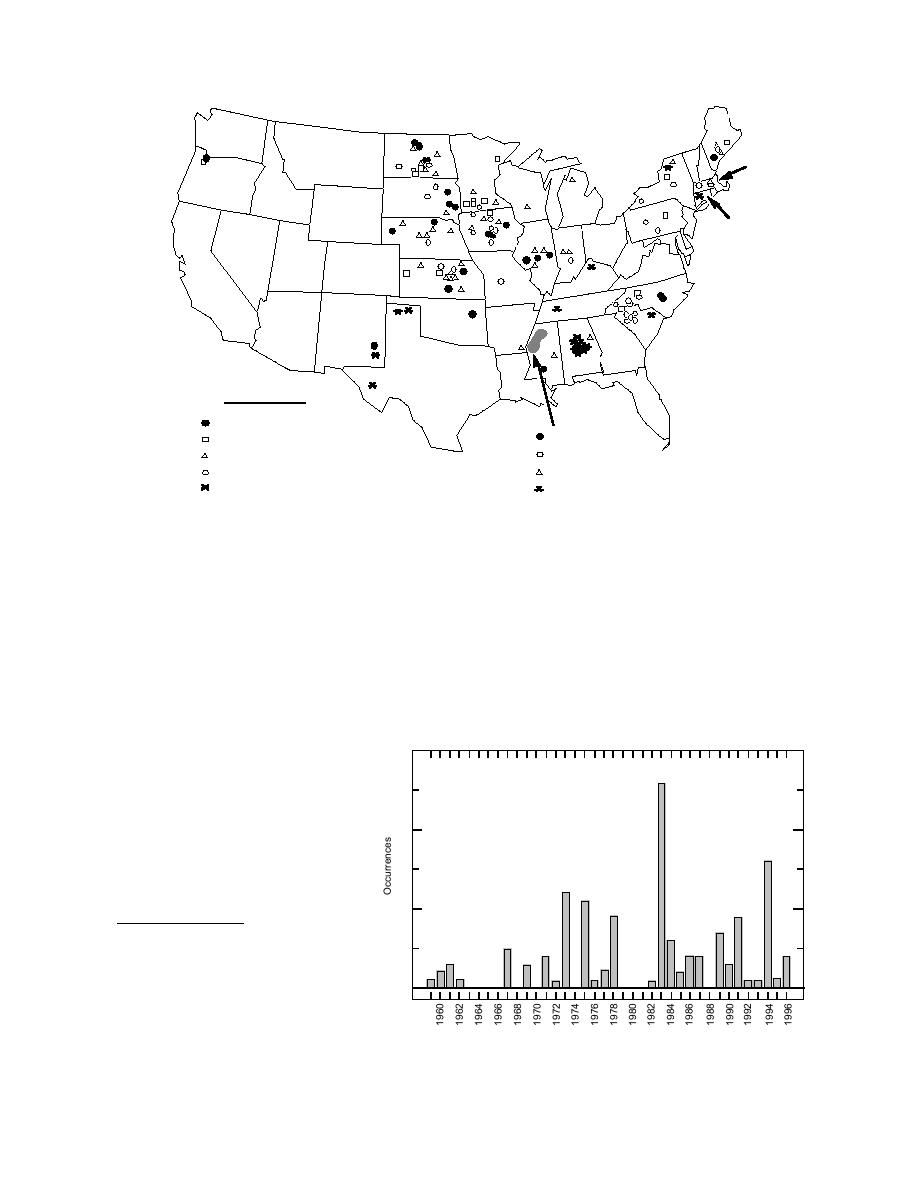
Figure 3. Icing-related tower failures since 1959. The boldfaced numeral in each state refers to the number of individ-
ual storms that caused the failures in that state.
ness accounts of the collapse itself, such as the date
ties collapsed. The 14 failures that I have confirmed to
and time of day, how the tower fell, how long after fail-
date for that storm are separately identified on the map.
ure before personnel arrived to assess the damage, sus-
Many sources reported that these towers failed under
pected cause of failure or whether a more formal engi-
radial ice thicknesses ranging from 4 to 6 in. Even
neering analysis was done to pinpoint the cause, and
though there was nearly no wind associated with that
the maximum distance outward from the tower base
storm, the damage to trees, powerlines, and crops in
that debris landed.
Mississippi alone was estimated at more than bil-
Figure 4 indicates that there have been several years
lion. The damage to eight of those towers, ranging from
in which major ice storms caused many failures over
172 to 530 ft tall with an average height of 344 ft, to-
talled nearly
||content||
.8 million.
Other geographic and topographic
30
information contained in this database
3
includes the tower's coordinates, base
elevation, height above average terrain
(HAAT),* and a description of the ter-
20
rain type upon which it was situated.
1
2.3 The Collapse
3
The database contains news and wit-
3
3
10
3
4
2
3
3
1
try term that describes a station's transmission
13
2
2
3
1
coverage. To calculate HAAT, the ground eleva-
1
1
4
1
1
1
1
11
1
1
tion above sea level (asl) is averaged at fixed
0
points between 2 and 10 air miles along eight
radial lines extending outward from the tower
base. HAAT is this average value subtracted from
the asl height of the antenna's center of radiated
Figure 4. Histogram of failures by year since 1959. The numeral shown at
power (Ennis 1979). HAAT might also be used
the top of each column is the number of individual storms that caused the
as a relative measure of a tower's exposure to
failures in that year.
wind and clouds, and therefore, in-cloud icing.
.
5


 Previous Page
