50
40
30
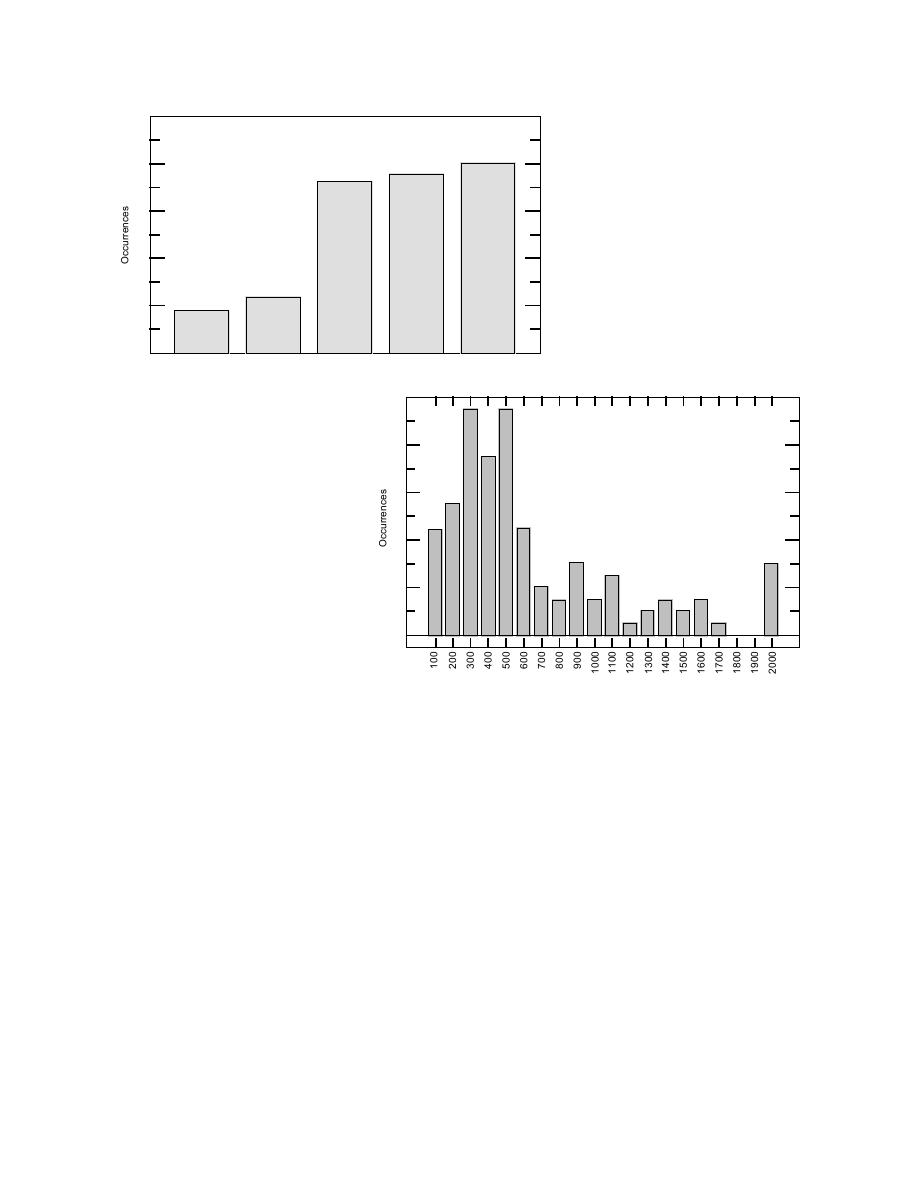
Figure 1. Histogram of failures by tower
20
type.
10
0
AM
CABLE
FM
TV
2-way
20
16
12
8
4
Figure 2. Histogram of failures by tower
height above ground level.
0
Height (ft)
the midwestern states and the Appalachian highlands.
121) were taller than 1000 ft. The mean and median
There have been at least six failures resulting from at
heights for the 121 cases were 607 and 480 ft, respec-
least four separate storms in each of North and South
tively.
Dakota, Minnesota, Iowa, Nebraska, and Kansas. Six
Other structural information in my database includes,
failures have occurred in Illinois, although from only
when available, the tower's wind and ice design loads,
two storms.
face width, anchor pattern, number of guy levels, and
The many failures in the southern Appalachian up-
other transmitting or receiving equipment on the tower.
lands of North and South Carolina and Alabama were
generally the result of fewer storms per state, compared
2.2 Geographic Location and Topography
with those in the upper Midwest. Those southern storms
Figure 3 shows where icing failures have occurred
were generally more widespread and severe. In Febru-
across the U.S. The numeral shown in each state indi-
ary 1994, the southeastern U.S. was hit by an unusu-
cates the number of separate storms that caused all the
ally devastating ice storm (Lott and Ross 1994). The
failures within that state. For example, three towers fell
storm caused over billion in damages and cleanup
in two separate storms in Texas; one in 1960 and two
costs, and at least nine deaths. An estimated 2.2 million
more in a 1978 storm. The map symbols indicate the
people in 11 states were without power at some point
height ranges of these towers.
during the storm and, in some locations, power was not
The data indicate that icing-related tower failures have
restored for a month (FEMA 1994). The lowland delta
occurred almost exclusively east of the Rocky Moun-
tains and 66% (93 of 140) occurred north of latitude N37
region of northwestern Mississippi, shown as a hatched
area in Figure 3, was especially hard hit. Nearly every
(i.e., north of Arizona, Oklahoma, Arkansas, Tennessee,
communication tower in Bolivar and Washington coun-
and North Carolina). The most failures have occurred in
3


 Previous Page
