11.3.2.2
Variability of the treatment recommendations with time
Previous demonstrations have shown a marked variability in treatment recommendations
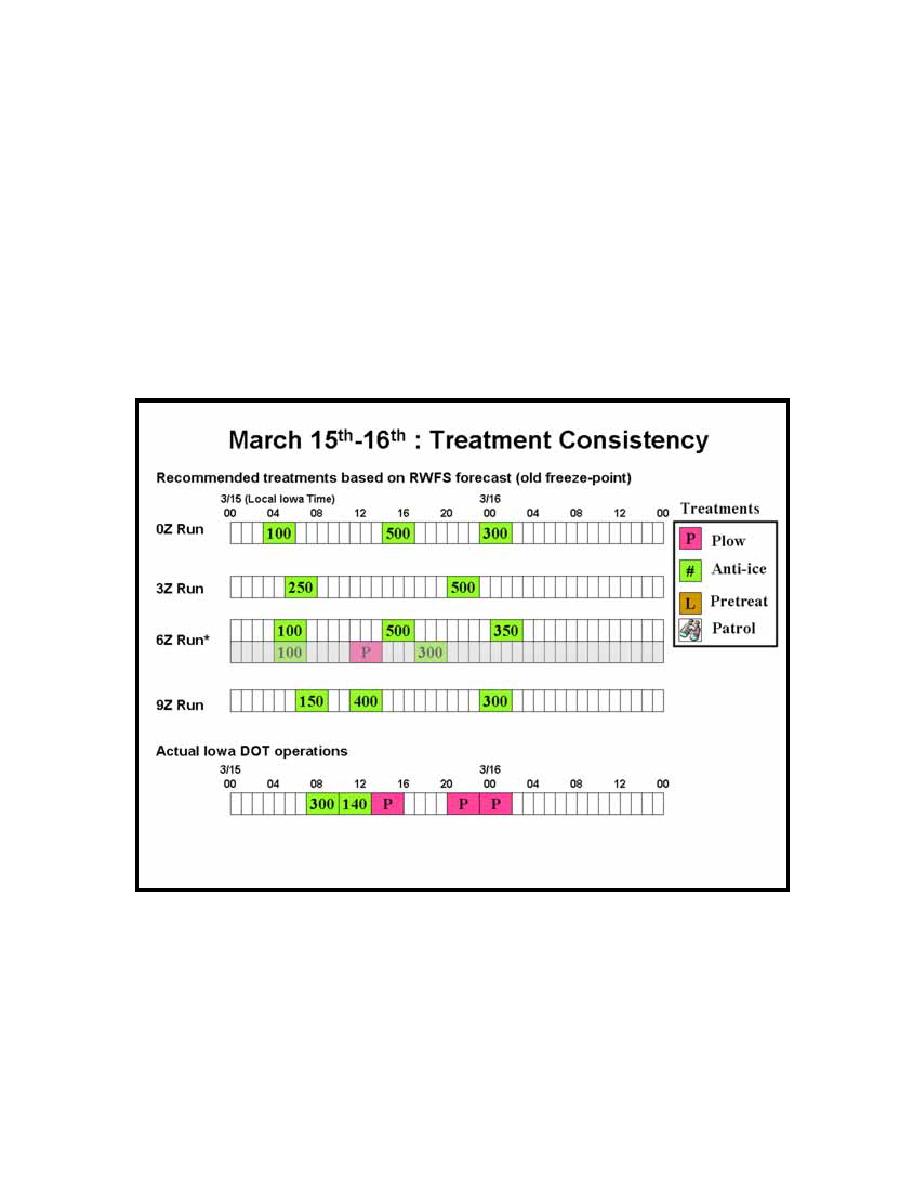
in successive forecast periods. Fig. 11.21 shows the treatment recommendation for March
15-16 on successive forecast periods. For this verification we are utilizing the MDSS runs
from real-time that are using the higher freeze-point threshold (35 F). The midnight run
(6Z run) shows both thresholds. In general for this case, the total tonnage of chemicals is
similar ranging from 750 to 950 lbs/lane-mile. Additionally, all but one of the MDSS
runs shows three treatment applications that are applied at roughly the same times. This
represents an improvement over the winter demonstration of 2003 where treatment
recommendations, even for fairly similar weather forecasts, yielded very different
treatment rates and application times.
Fig. 11.21 Comparing successive forecast period treatment strategies for March 15-16.
11.3.3 Verification report for January 25-26, 2004
The January 25-26 event was a light snow event that lasted roughly 20 hours starting just
around midnight on the 25th. The selected route is the I35N route serviced by the Ames
garage. Fig. 11.22 shows the RWFS forecasted conditions and RCTM recommended
121


 Previous Page
