

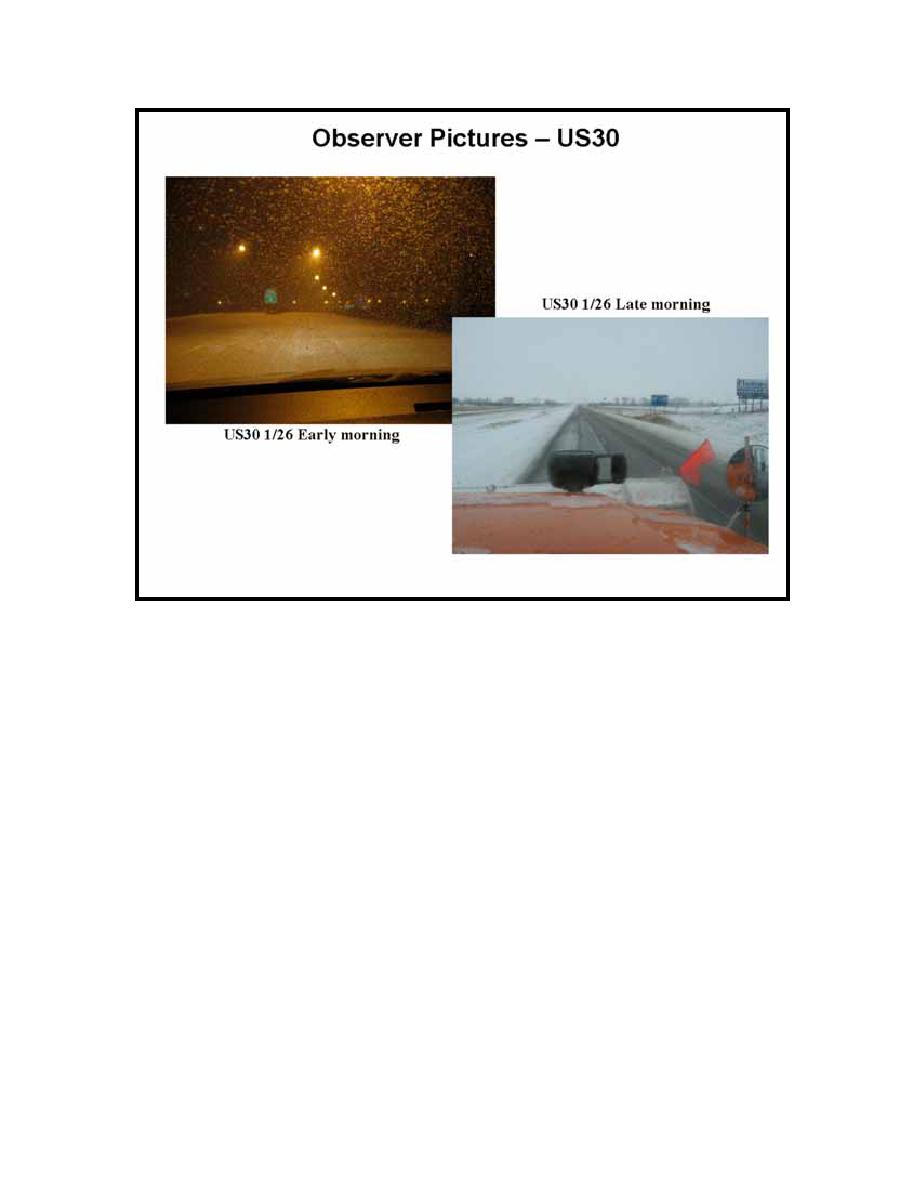
Fig. 11.24. MDSS observer photographs of (a-left) US30 early morning on January 26
and (b-right) US30 late morning on January 26.
11.3.3.2
Variability of the treatment recommendations with time
Fig. 11.25 shows the treatment recommendation for January 26 on successive forecast
periods. For this verification we are utilizing the model runs from real-time that are using
the higher freeze-point threshold (35 F). In general for this case, the total tonnage of
chemicals is similar, ranging from 650 to 800 lbs/lane-mile. Additionally, all of the
MDSS runs show between 5 and 6 treatment applications that are applied at roughly the
same times. The trend of the treatment applications toward lower overall treatment
applications and tonnage as the event approaches also stays consistent.
125

 Previous Page
