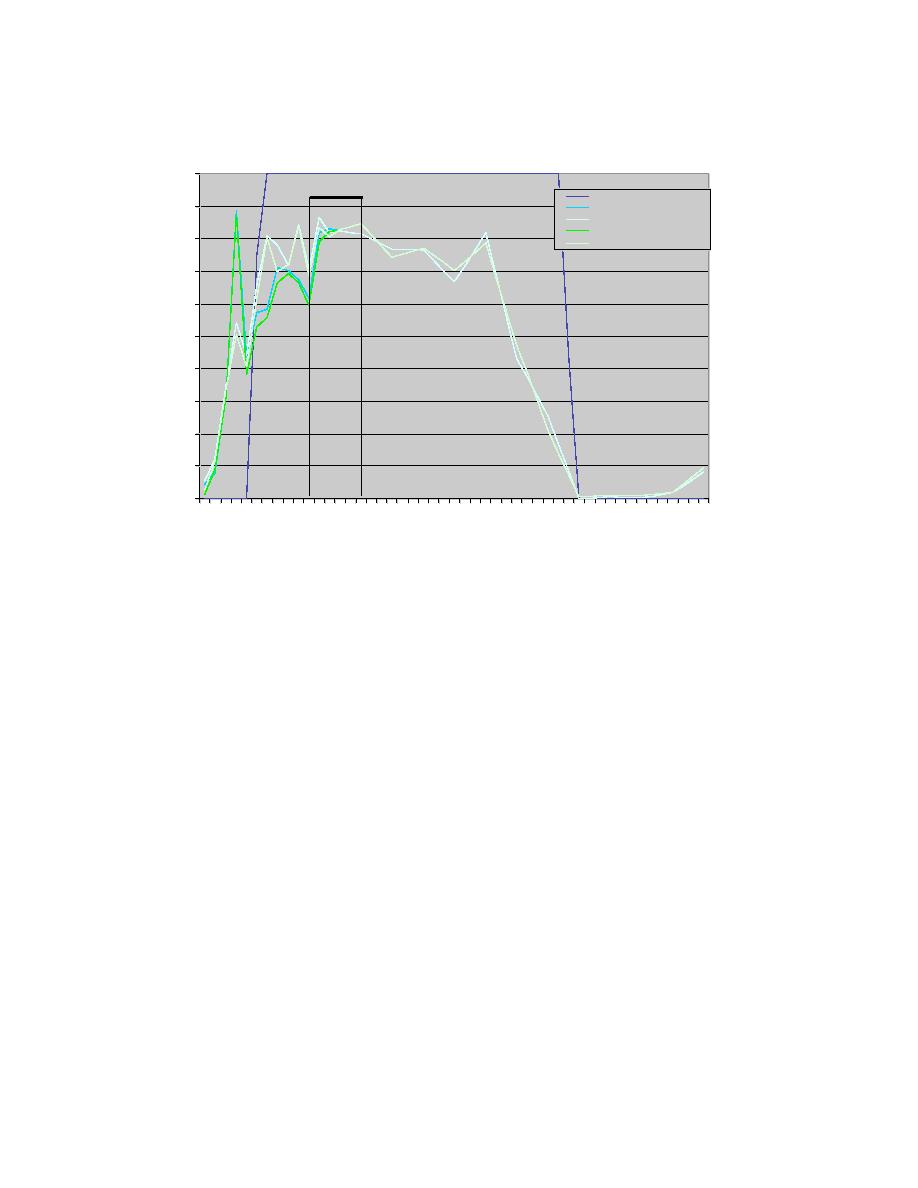
Cloud Comparison for Jan 16, 2004
1
OVC
AMW OB
AMW METAR OB
0.9
AMW METAR wFSL
AMW METAR woFSL
AMW RWIS wFSL
0.8
AMW RWIS woFSL
0.7
BKN
0.6
0.5
0.4
SCT
0.3
0.2
0.1
0
CLR
12 14 16 18 20 22 0 2 4 6 8 10 12 14 16 18 20 22 0 2 4 6 8 10 12
Jan 18, 2004
Jan 17, 2004 Time (UTC)
Fig. 10.10. Cloud cover time-series plot comparing the Ames METAR
only to the RWFS forecasts (both with and without the FSL supplemental
models) for the METAR and RWIS site. The vertical lines represent the
time period that the Ames METAR was reporting falling precipitation.
A comparison of RMSE values for all the sites in Iowa combined versus the site at Ames
(Fig. 10.11) reveals the same pattern of errors, however the errors were larger at Ames
than those for all sites. The temperature and dew point errors are consistently about 1C
higher at Ames then for all the sites. When combining the errors for all the sites, the
RMSE values for wind speed gradually increased with time and at Ames they were much
more variable, but again, increased with time. The cloud cover forecast was worse at
Ames, especially later in the forecast run. The bias plot comparison (Fig. 10.12) again
shows that biases at Ames were similar to those for all sites.
34


 Previous Page
