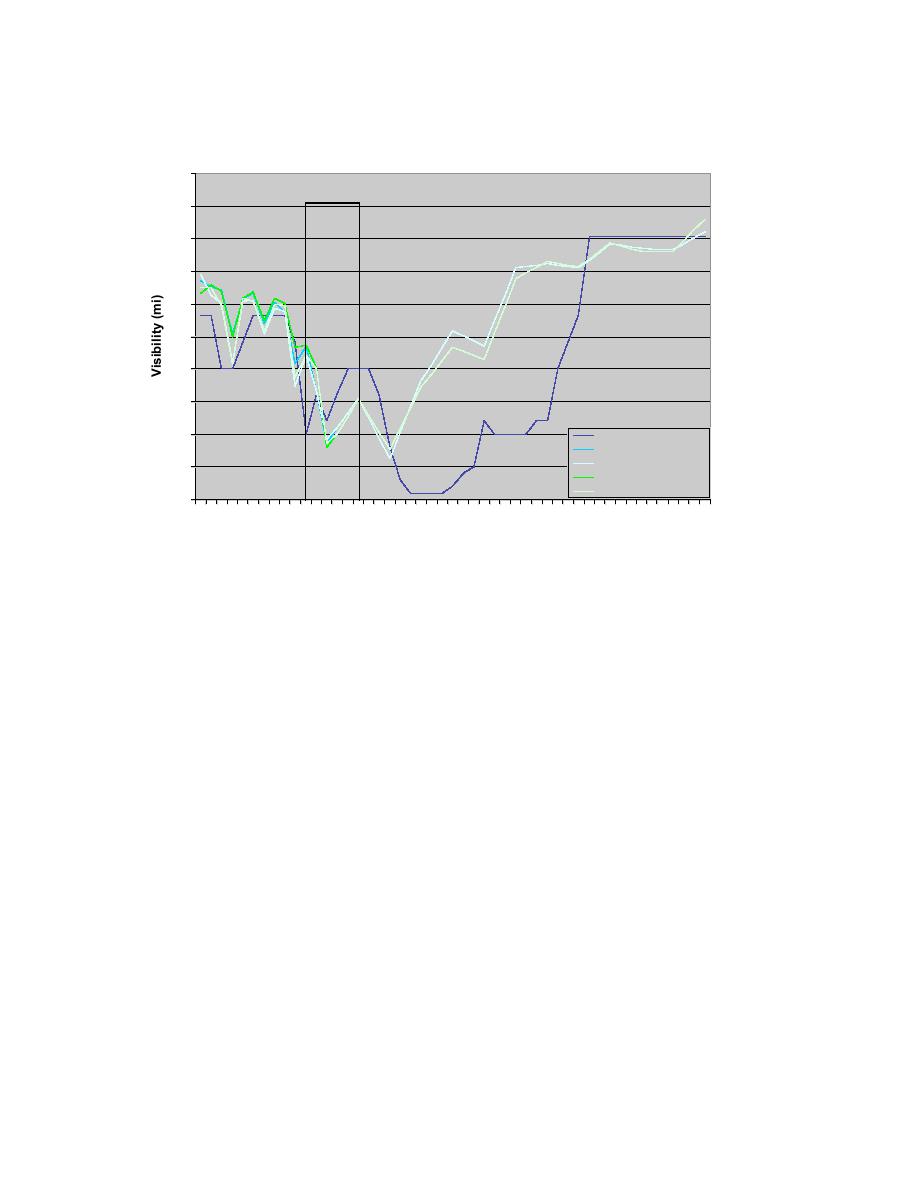
Visibility Comparison for Jan 16, 2004
20
AMW OB
18
16
14
12
10
8
6
4
AMW METAR OB
AMW METAR wFSL
AMW METAR woFSL
2
AMW RWIS wFSL
AMW RWIS woFSL
0
12 14 16 18 20 22 0 2 4 6 8 10 12 14 16 18 20 22 0 2 4 6 8 10 12
Jan 17, 2004 Time (UTC)
Jan 18, 2004
Fig. 10.6. Same as Fig. 10.4, except for visibility (mi).
From the 12 UTC run the forecast precipitation start time was 22 UTC both with and
without the FSL supplemental models at both the METAR and RWIS sites. This was
essentially the time that the actual precipitation started at the Ames METAR site (Fig.
10.7). In this run, the precipitation was predicted to end at ~11 UTC on 17 January,
which was about 7 hours later than it actually ended. The 18 UTC run also predicted the
precipitation start time very well and was somewhat closer in its forecast of the end time
(Fig. 10.8). Still, the system predicted the rain to last for 5 hours beyond its actual end
time. The forecast issued by the NWS office at 415 AM CST on 16 January (0515 UTC)
called for:
.TODAY...RAIN SHOWERS LIKELY IN THE AFTERNOON. HIGH IN THE
UPPER 30S. SOUTHEAST WIND 10 TO 15 MPH. PRECIPITATION CHANCE 60
PERCENT.
.TONIGHT...WARMER. RAIN THEN RAIN LIKELY AFTER MIDNIGHT.
LOW IN THE LOWER 30S. SOUTHEAST WIND 10 TO 15 MPH SHIFTING TO THE
EAST AROUND 5 MPH AFTER MIDNIGHT. PRECIPITATION CHANCE 80
PERCENT.
It is seen here that the NWS also called for the rain to continue after midnight when in
reality it ended by 10 PM CST on 16 January (3 UTC 17 January). At 100 PM CST (20
UTC) the NWS issued a new forecast for the day but the wording was left the same for
both the remaining portion of the day and that night. These forecasts are very similar to
the timing of the precipitation predicted by the RWFS for this event.
30


 Previous Page
