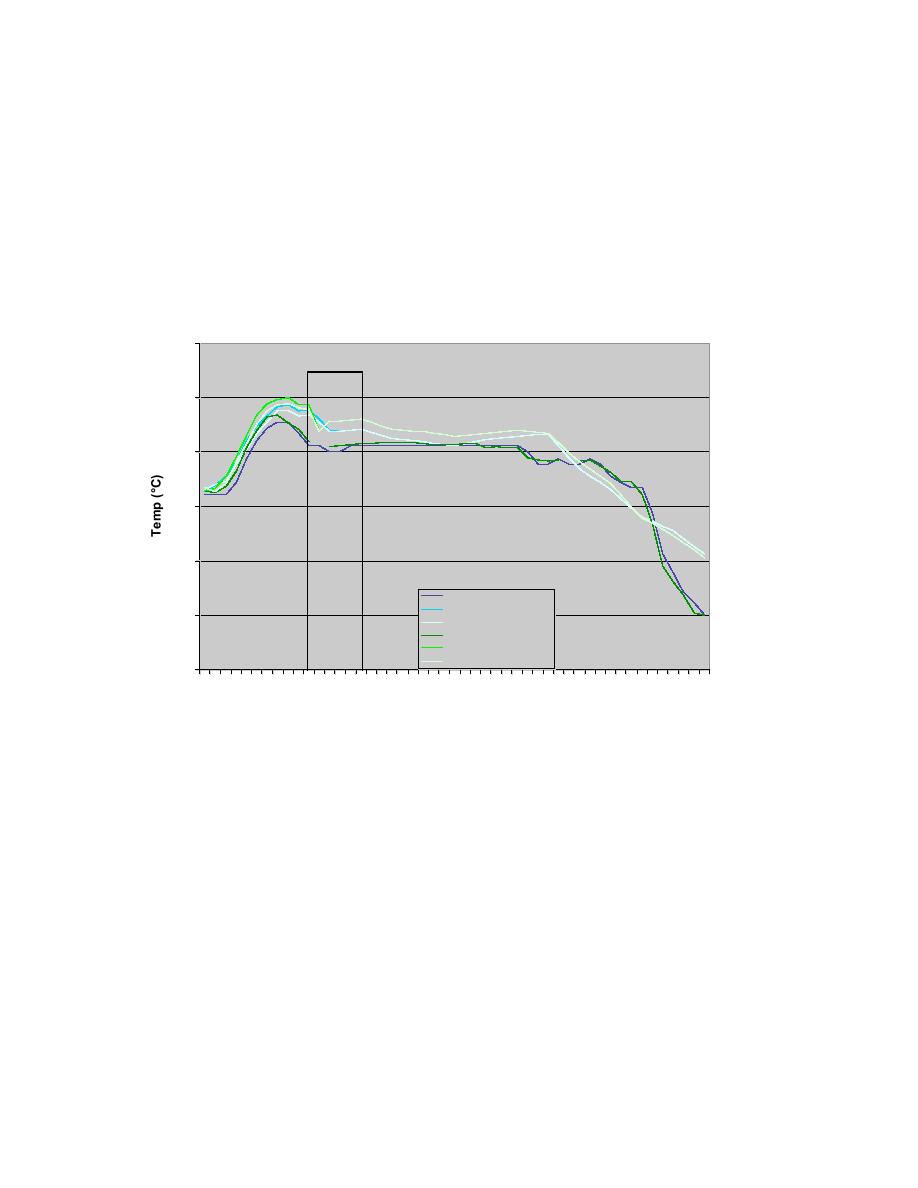
For this event, the 12 UTC MDSS run from 16 January 2004 is examined for all
parameters. The 18 UTC run from 16 January 2004 is also used to further assess
precipitation end time predictions. The air temperature forecasts are fairly close to the
observed air temperature for much of the time series, but tended to be warm by 1-2C
(Fig. 10.4). Because actual air temperatures were just above 0C during the time of the
rain event, the slightly warm forecasts could have resulted in a mis-forecast of the
precipitation type. This did not end up being the case, however.
Air Temperature Comparison for Jan 16, 2004
10
AMW OB
5
0
-5
-10
AMW METAR OB
AMW METAR wFSL
-15
AMW METAR woFSL
AMW RWIS OB
AMW RWIS wFSL
AMW RWIS woFSL
-20
12 14 16 18 20 22 0 2 4 6 8 10 12 14 16 18 20 22 0 2 4 6 8 10 12
Jan 17, 2004 Time (UTC)
Jan 18, 2004
Fig. 10.4. Air Temperature (C) time-series plot comparing the Ames
METAR and Ames RWIS observations to the RWFS forecasts (both with
and without the FSL supplemental models) for the METAR and RWIS site.
The vertical lines represent the time period that the Ames METAR was
reporting falling precipitation.
28


 Previous Page
