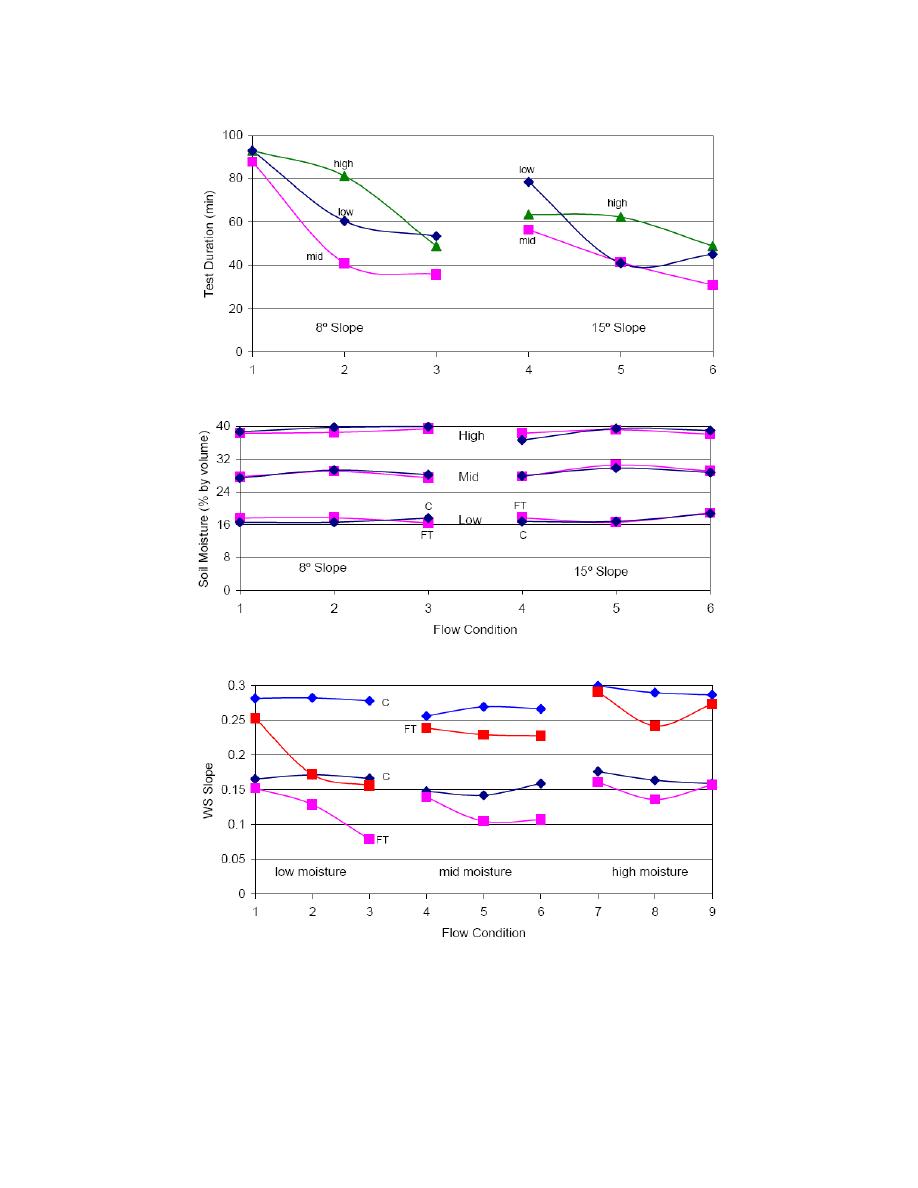
Figure 4. Test duration (min) of each soil moisture series (low, mid, high) plotted against flow condition,
where tests 13 and 46 represent low, mid, and high flow conditions, respectively, for 8 slope
and 15 slope conditions. Pre-test C and FT soil moisture contents with flow condition (13, 4
6) for each slope condition. Post-test C and FT water surface slopes with flow condition (13,
46, 79) for each soil moisture series.
18


 Previous Page
