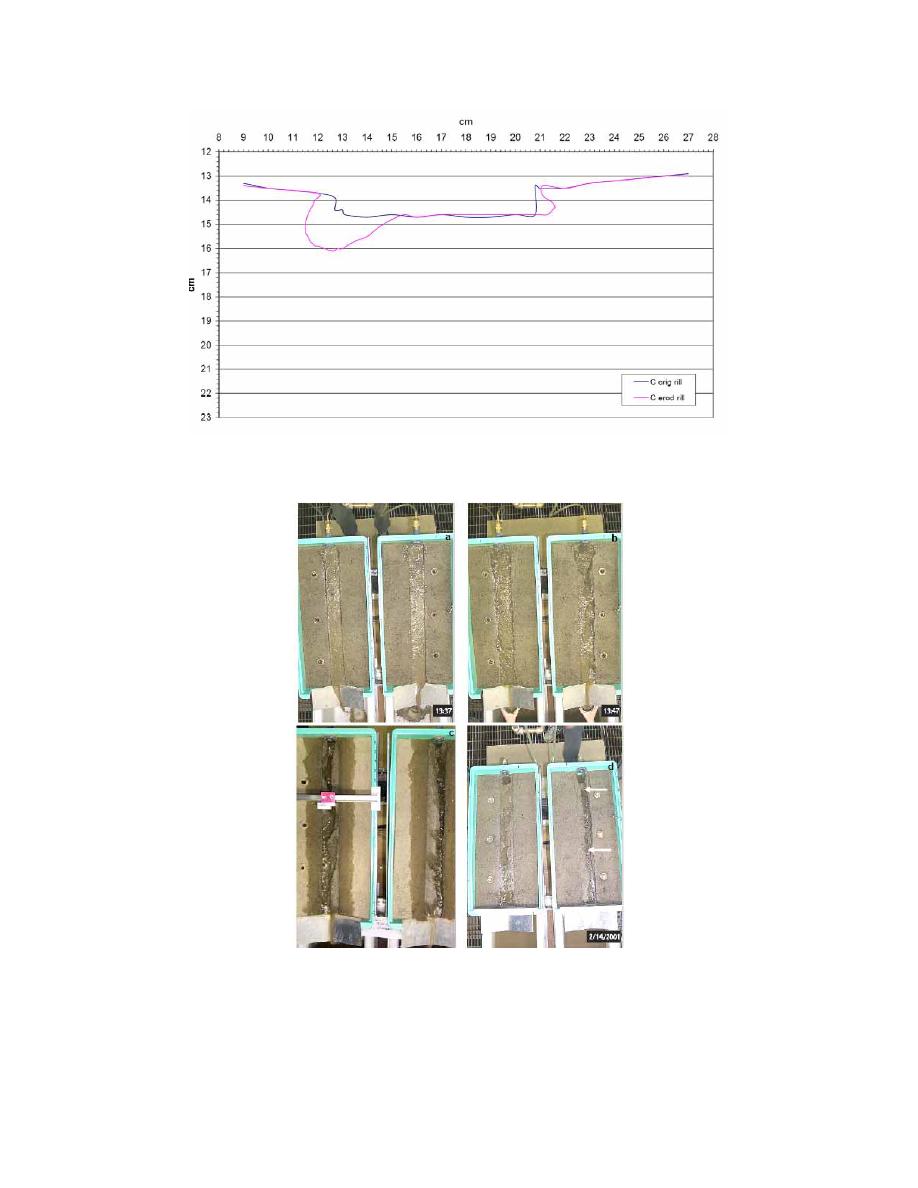
Figure 2. Cross sections of imposed and eroded rills at 55 cm (0.7L) above the outlet in the FT and C bins
for the mid-moisture, 15-slope, high-flow experiment.
Figure 3. Typical development sequence of an eroding rill: a) shallow sheet flow across the imposed rill,
b) parallel multi-channel flow, c) single enlarged channel flow with sliding pin meter shown,
and d) knickpoint formation in the FT (right) bin.
17


 Previous Page
