III-3. COMPOSITE SAMPLING AND ANALYSIS
67
open water stretching at least 20 m in one di-
Areas A or C/D. The regions we sampled are
mension. We also collected two grid compos-
not likely sources of waterfowl poisonings.
ites from the undrained portion of Pond 146,
located north of Clunie Inlet (Fig. III-3-5). A
Northern C
small beaver dam separates this portion of the
Area C/D borders the marsh in Northern
pond from Clunie Inlet and prevents water
Area C. Our sampling this year detected white
from draining completely to the pump sump
phosphorus in Pond 171, located due south
in the southern end of Pond 146.
of Pond 155. The concentration found was 0.03
g/g. Because we know how many
subsamples made up this grid composite, we
can calculate the maximum possible concen-
RESULTS AND DISCUSSION
tration in a subsample simply by multiply-
ing the number of subsamples (48) by the con-
Northern A and C/D
We did not detect white phosphorus in any
centration. The composite concentration was
0.03 g/g and there were 48 subsamples, so
of the grid composites collected this year in
Clunie
Inlet
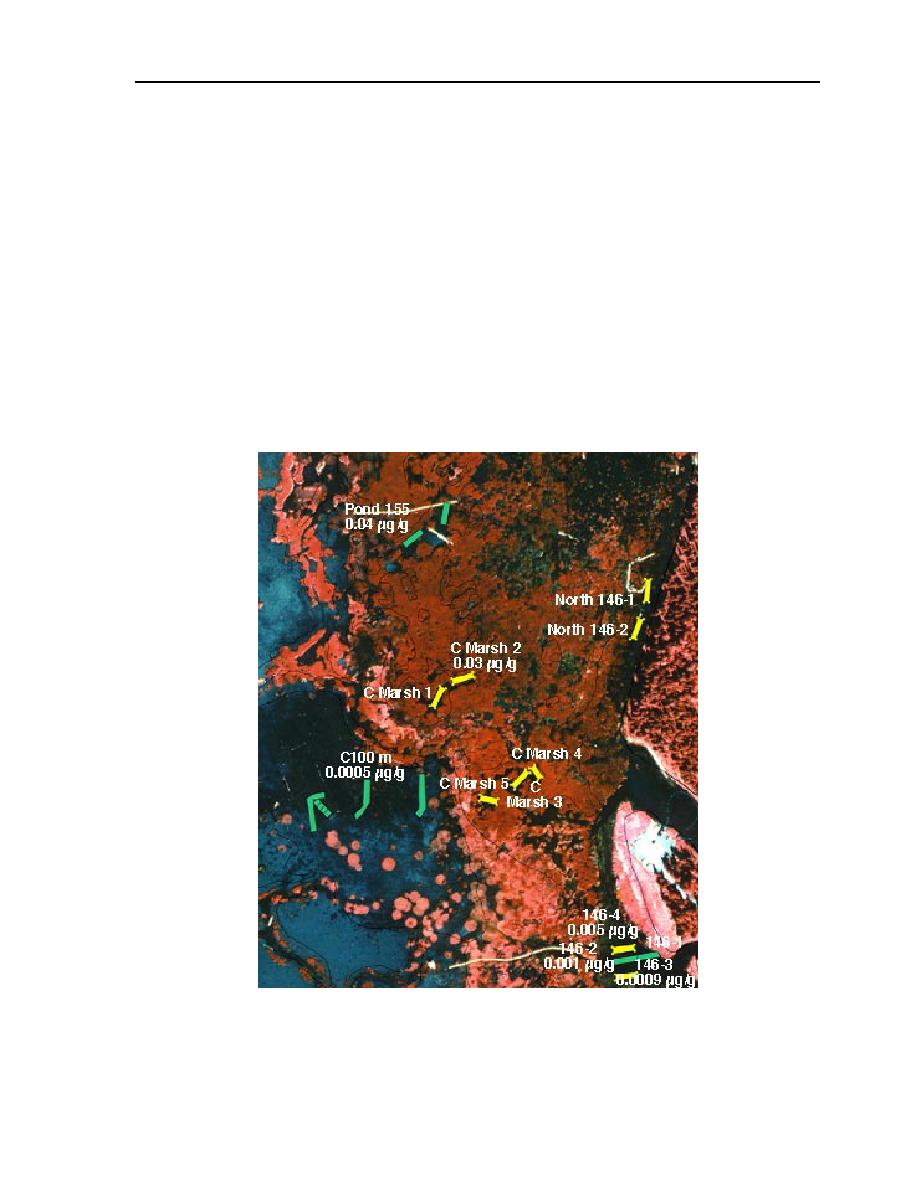
Figure III-3-5. Aerial photo (Aeromap 16 August 1995) with loca-
tions of 2000 grid composites (yellow) and 19971999 grid com-
posites (green). For those samples in which white phosphorus was
detected in 2000, concentrations are shown.


 Previous Page
