EAGLE RIVER FLATS FY 00
50
40
5.0
Area C Piezometer Site
Tension
35
4.8
30
4.6
25
20
Surface Elevation
4.4
15
4.2
10
4.0
5
0
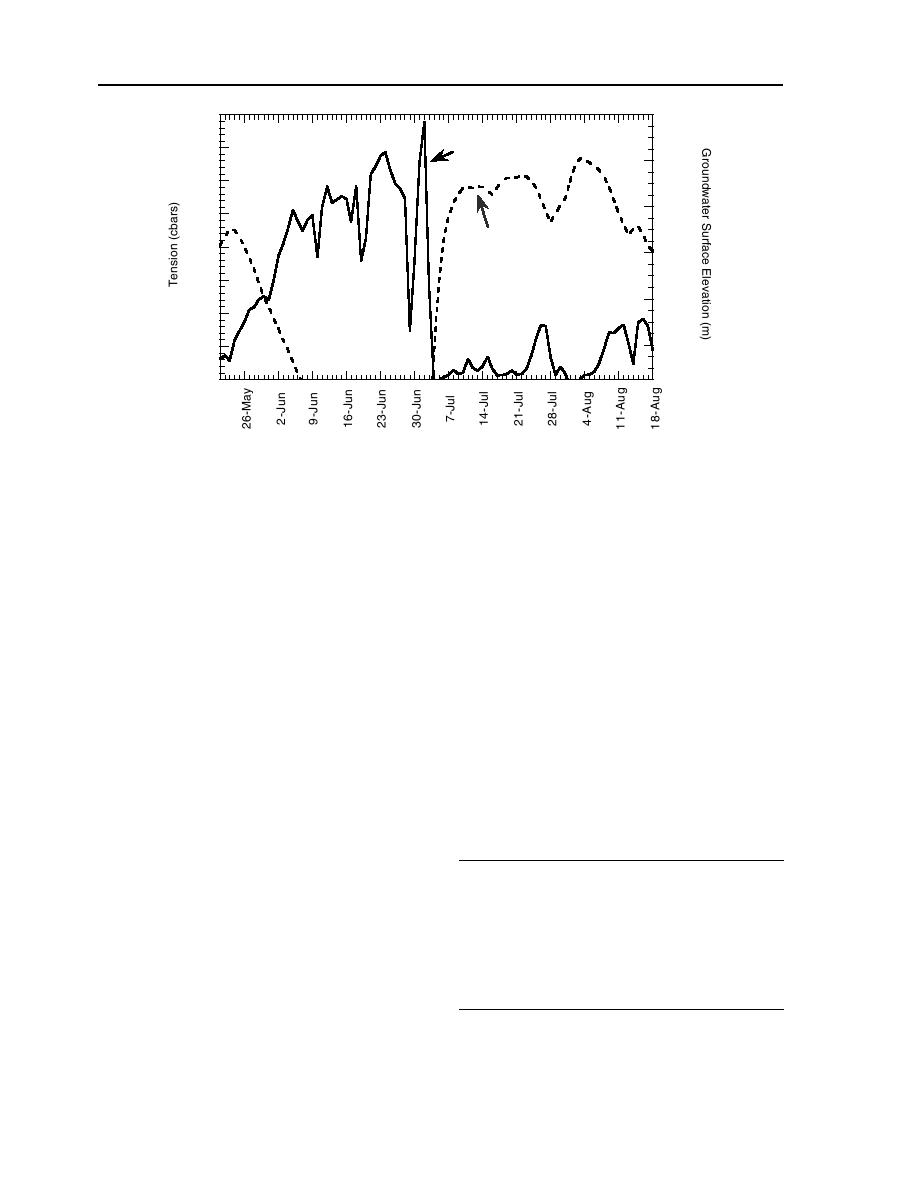
Figure III-2-10. Groundwater surface elevation in the piezometer well located in
Area C and the corresponding moisture content (tension) of the surface sediment
(elevation 4.77 m). A rise in tension indicates drying.
June 2000 at 1700 hours. Because of the low
The subsurface samples we collected also
elevation of this station (4.15 m), the 24-hour
showed a decline in white phosphorus resi-
a v e r a g e flooding tide heights at the
dues. At location #53, which is adjacent to the
datalogger in Pond 146 far exceed those at
dredged channel in Pond 146, white phospho-
rus concentrations were almost 200 g/g in
other stations, surpassing 0.8 m on 1 August
2000. Particles planted in Pond 146 declined
1992. In 1999, white phosphorus concentra-
tions were still high (>1 g/g) (Table III-2-3).
in mass by 27%; composite samples showed
a greater loss, with one sample declining from
The sump in Pond 146 was deepened in the
7.31 g/g in June 1999 to 0.001 g/g in Au-
gust 2000.
We have observed significant declines in
Table III-2-5. Loss of white phosphorus from
white phosphorus concentrations in Pond 183
particles planted in the top 5 cm of drained
in discrete samples collected from sites where
ponds. The locations correspond to data sta-
high concentrations of white phosphorus
tions in Table III-2-4.
were found prior to draining. The DWRC Pen
Datalogger
#5 (Fig. III-2-3), used in 1992 to 1993 for the
Location
Loss*
evaluation of methyl anthranilate, is one such
site. We intensively sampled this pen in 1996,
C 100 m
56%
taking discrete samples at the nodes of a 1.82-
BT North 100 m
79%
BT South 100 m
32%
m-square grid 4 columns wide and 12 rows
Pond 155
32%
long. In 1996, all 48 samples contained detect-
Pond 146
27%
able white phosphorus concentrations rang-
Pond 730 Station 2
10%
ing from 0.0024 to 421 g/g (Table III-2-2).
Pond 75
12%
Pond 258
89%
Over 300 white phosphorus particles were
Pond 256
92%
found, one of which weighed 150 mg (M.E.
*Nominal initial mass was 5.6 0.5 mg for each of five par-
Walsh et al. 1997). By the fall of 2000, white
ticles yielding an initial total mass of 28 mg. Loss was com-
phosphorus concentrations were above 0.001
puted as follows: 1 (sum of mass remaining)/(total initial
g/g in only four samples (Fig. III-2-7).
mass).


 Previous Page
