III-2. TREATMENT VERIFICATION
49
80
4
C 100 m
70
tension
5 cm resistance
- - - - 10 cm resistance
60
3
50
40
2
30
Mean Temp
14.6C
20
Max Temp
1
18.6C
10
0
2.0
Area C Piezometer Site
5 cm
- - - - 10 cm
20 cm
1.6
X-X-X 30 cm
1.2
0.8
0.4
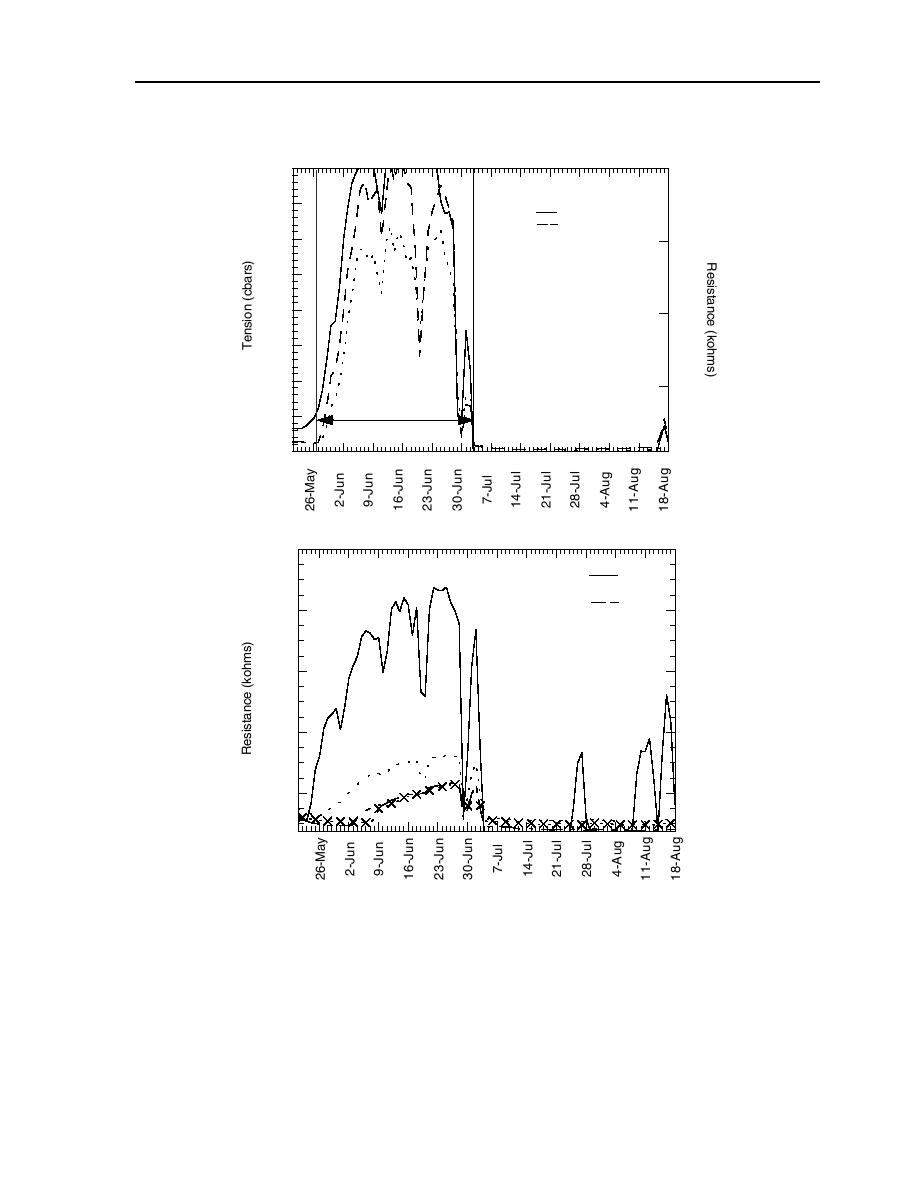
Figure III-2-9. Output from moisture sensors during the summer of 2000.
Increases in resistance and tension indicate drying. Temperatures are 24-
hour averages. High temperatures increase the rate of loss of white phos-
phorus.


 Previous Page
