High Spatial Resolution Digital Imagery
47
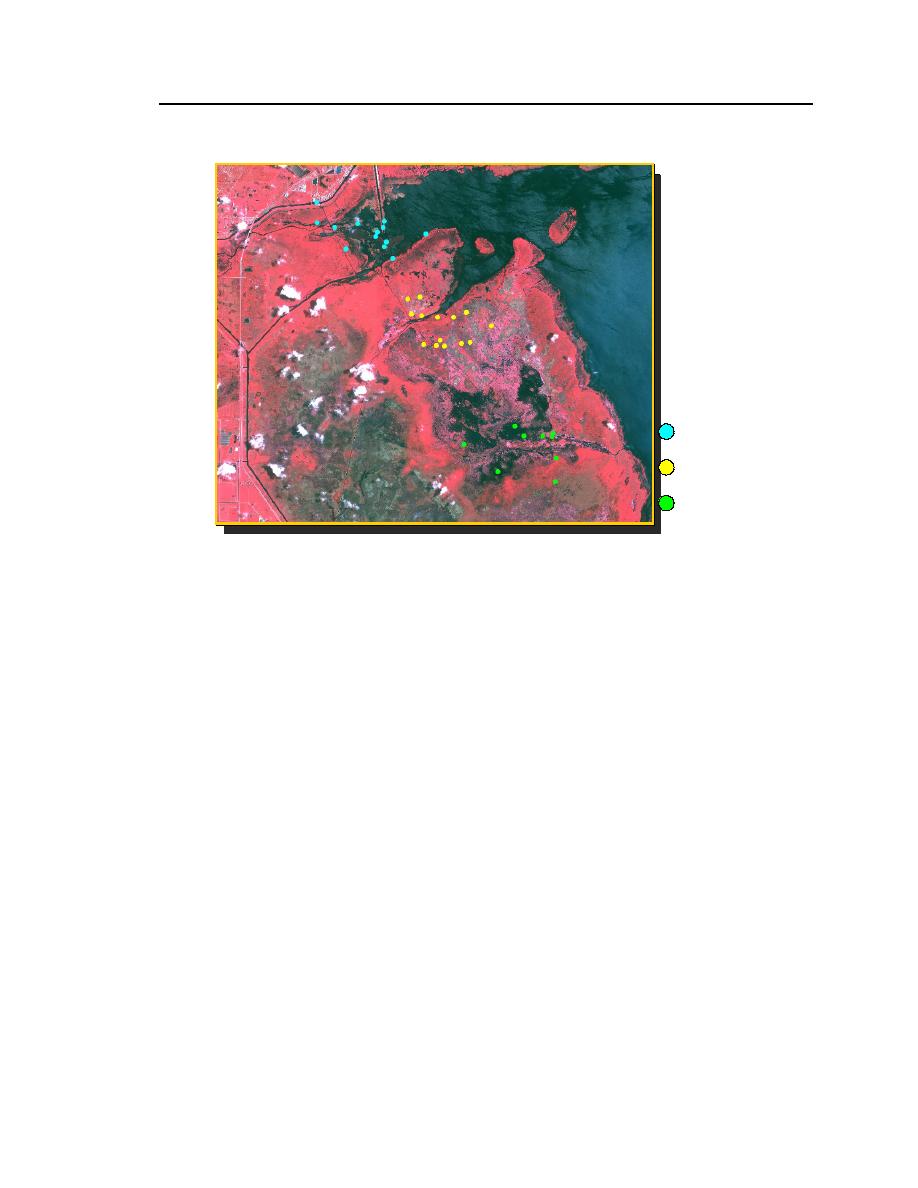
Fisheating Bay
Monkey Box
Moonshine Bay
Figure 27. Location of field plots established during 9 December 2001
CAMIS image acquisition.
The Refuge provided additional field data, collected during the summer of
2000. These data were reported as percent vegetative cover, by species, within 1-
m2 quadrats. The plots were divided into five areas (2 through 6) throughout the
southeast portion of the Blackwater Refuge and the northeast portion of the
Fishing Bay Wildlife Management Area. Areas 2 and 3 were located just west of
Shorters Warf Road. Areas 4, 5, and 6 were to the east, in the Fishing Bay Area,
and were not located within the southern ASAI mosaic. The 240 quadrats within
areas 2 and 3 supported non-woody vegetation. Litter, mud, or water occupied
non-vegetated areas within the plots. Only those plots with at least 50% cover by
any of three dominant species were used for spectral signature extraction. Given
that the radiometric variation between some flightlines in the southern mosaic
approached 20%, it was assumed that subtle spectral variations associated with
mixed species compositions in many plots would be lost in the between-flightline
noise. Therefore, a total of 111 quadrats were determined to be suitable for sig-
nature extraction. Figure 29 displays the locations of these sample sites and indi-
cates the dominant species present. The accuracy of the geographic coordinates
for these data is unknown.


 Previous Page
