0
Top
Bottom
5
Right
Left
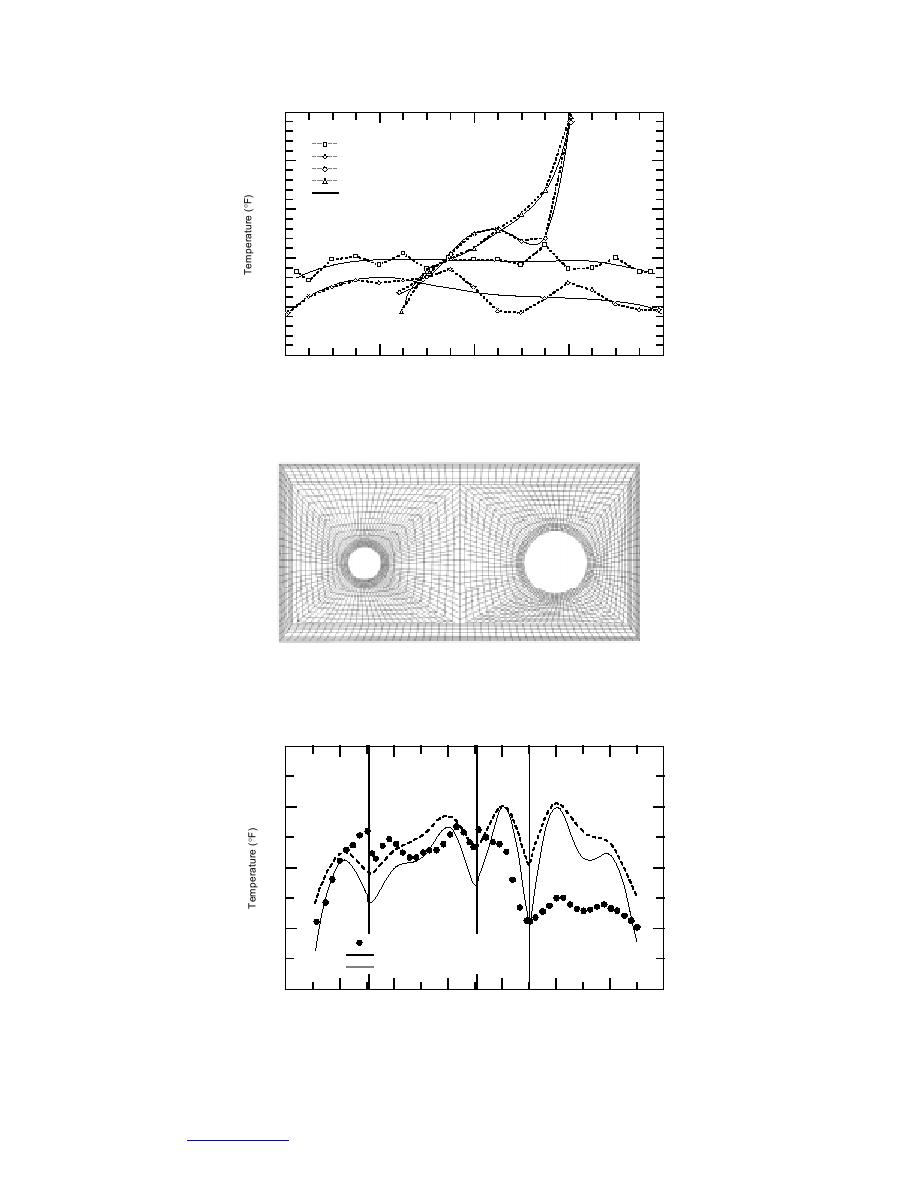
Curve Fit
10
15
20
25
1
0
1
2
2
Location on Given Surface (ft)
Figure 52. Polynomial curve fits to experimental boundary data.
Figure 53. Finite element mesh used for conduction solution
of the 2-ft 4-ft enclosure.
20
Left Side
Top
Right Side
Bottom
10
0
10
Experimental Data
Numerical (keff=0.22863)
Numerical (keff=0.752115)
20
2
0
2
4
6
8
10
12
Location on Inside Insulation Surface (ft)
Zero is Midway Up the Left Side
Figure 54. Comparison of experimental and numerical inside insula-
tion surface temperatures (data from 13 January 1997).
48
Go to Contents


 Previous Page
