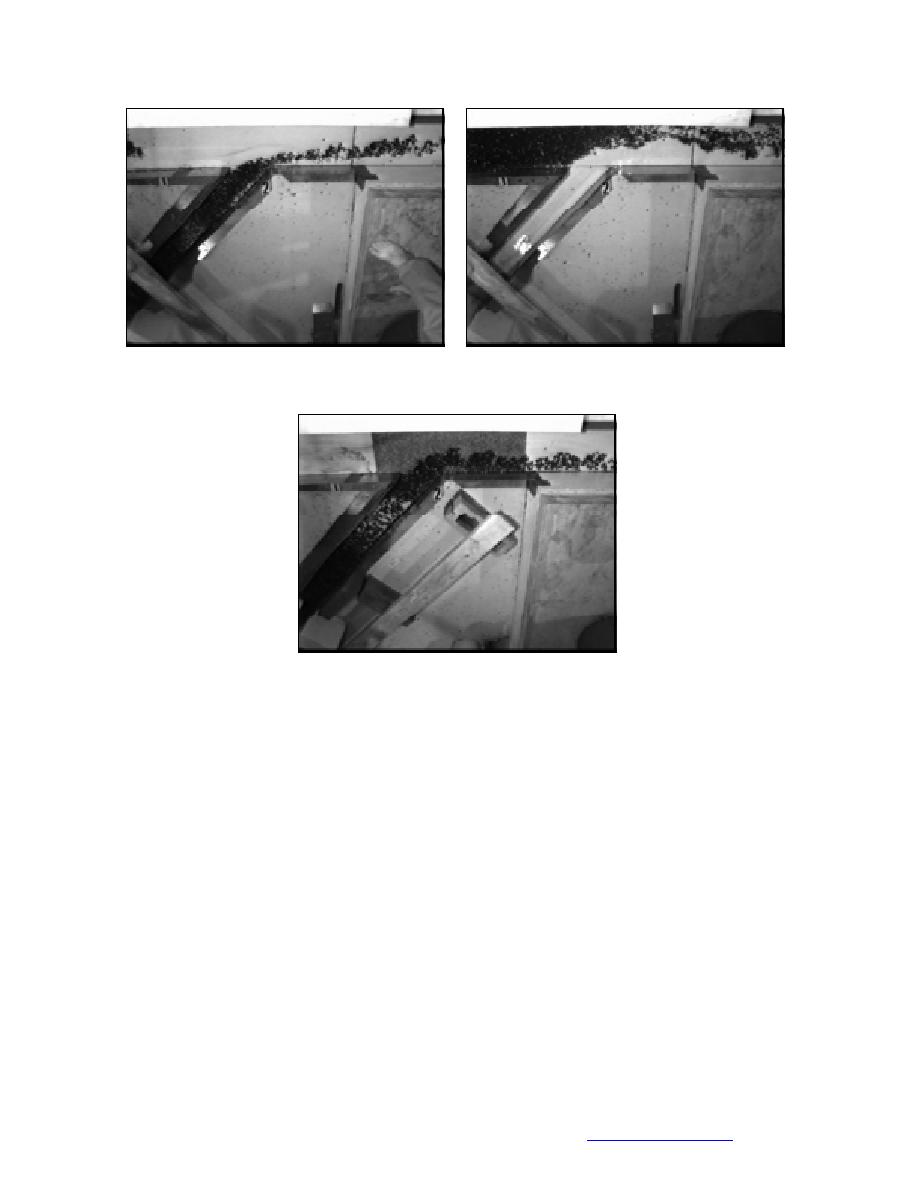
Figure 26. Ice in confluence: Q2/Q1 = 2/3, α = 45,
Figure 27. Ice in confluence: Q2/Q1 = 3, α = 45, and
and b1/b2 = 1.5.
b1/b2 = 1.5.
Figure 28. Ice in confluence: Q2/Q1 = 0.6, α = 45,
and b1/b2 = 1.35.
Figure 27 illustrates the approximate position of the dividing streamline and
shows a jam formed in channel 1.
Case 3: Q2/Q1 = 0.6, Q1 = QMississippi = 40,000 cfs (1133 m3/s); Q2 = QMissouri =
25,000 cfs (708 m3/s) ; b1/b2 = 1.35; b2 = 16 cm. This case replicates the actual
geometric and hydrodynamic characteristics of the confluence of the Missis-
sippi and Missouri Rivers, except that the channels were rectangular in cross
section. The selected discharges are based on an evaluation of ice jam condi-
tions at the confluence, as discussed subsequently. In this example no jam
formed. Ice from the simulated Missouri River passed through the conflu-
ence, as shown in Figure 28. This example indicates the significant role played
by the bar in the actual confluence.
Case 4: With bar and border ice in place (cf. aerial photograph from 9 Janu-
ary 1979 shown subsequently as Fig. 36); Q2/Q1 = 0.6, Q1 = QMississippi = 40,000
cfs; Q2 = QMissouri = 25,000 cfs; b1/b2 = 1.35; b2 = 16 cm. This case was selected
following an analysis of a sequence of jamming events at the confluence of
the Mississippi and Missouri Rivers; the analysis is discussed in the next
section of the report. The presence of the bar along the inner bank of the
confluence and, during frigid conditions, the formation of border ice attached
35
Back to contents page


 Previous Page
