0
a.
0
100
4
200
8
300
12
0
10
20
30
40
50
Distance (m)
a. 100-MHz transducer.
0
b.
0
10
1.0
20
30
1.5
40
2.0
50
0
10
20
30
40
50
W
E
Distance (m)
b. 400-MHz transducer.
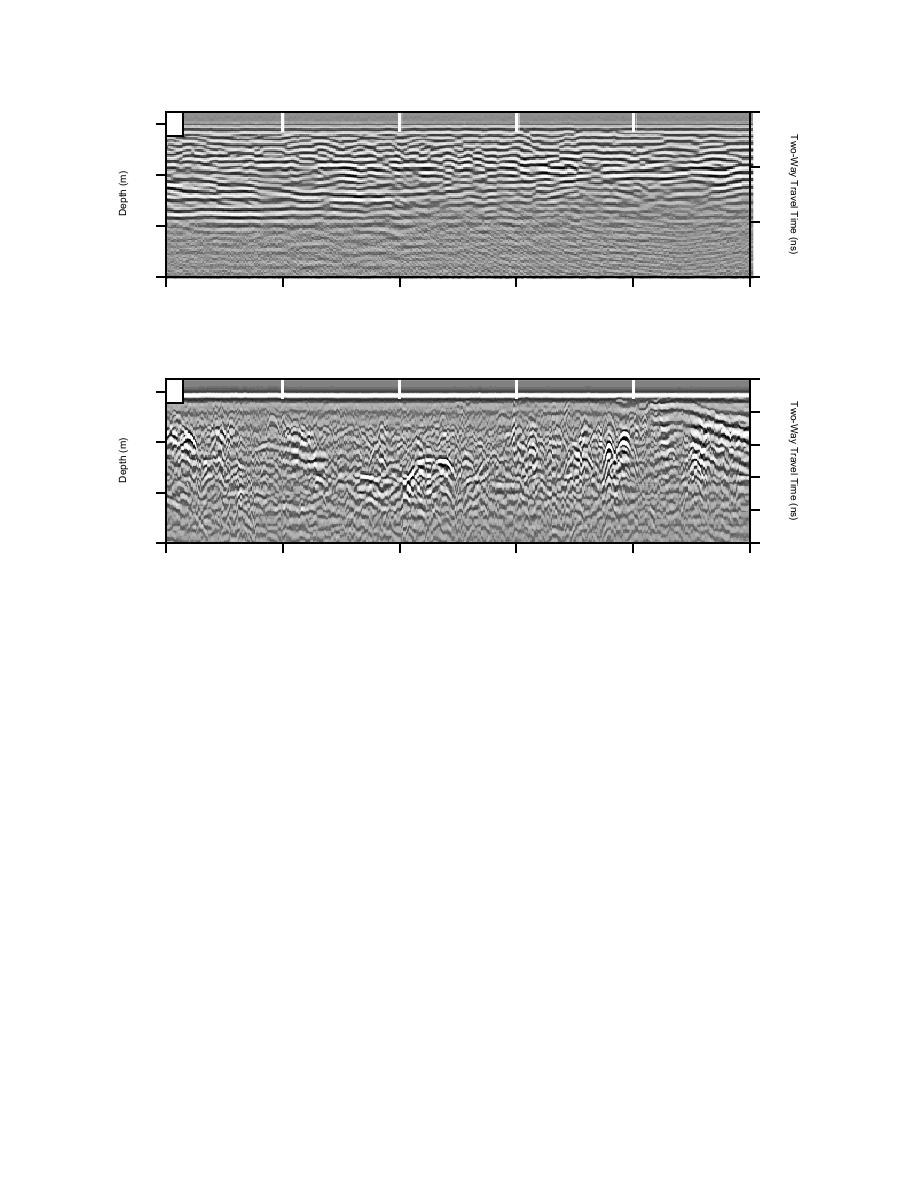
Figure 9. Profile recorded along transect 1 away from the bunker excavation.
use of the mean ε = 11.3, the time range settings
RESULTS
for the 100- and 400-MHz transducers provided
Eight transects were run near the bunker and
an approximate depth range of 12.4 and 2.0 m,
transmitter annex, with five eastwest transects
respectively, in these materials. The in-situ signal
selected for use in this report (1, 2, 3, 5 and 9; Fig. 5).
wavelengths are about 25 cm at 400 MHz and 1.0
m at 100 MHz. Accurate depth calibration of the
radar records is difficult, however, owing to the
Transect 1
This 50-m transect was located south of the
local variability in these glacial deposits.
known limits of the buried bunker and utilidors
(Fig. 9 and 10). The 100-MHz profile shows a sub-
Measurements
surface horizon, which we interpret to be an exca-
The site was surveyed during the summer of
vation surface. It varies from a depth of 4 to 6 m,
1996, when the ground surface was dry. The con-
reaching its maximum depth about 18 m from the
trol unit and data recorder were operated from the
east side of the transect line. At distances of 0 to
front passenger seat of a 4-wheel drive vehicle and
10 m and 35 to 50 m along the transect,
powered directly from the vehicle's electrical sys-
subhorizontal reflectors resembling fluvial layer-
tem. The 100-MHz transducer was placed in a
ing are present at depths between 5 and 7 m. These
wooden sled to reduce abrasion on the bottom of
deeper reflectors are truncated by a prominent
the antennas and was towed approximately 10 m
horizon that appears to be the limit of an excava-
behind the vehicle (Fig. 8a). The smaller 400-MHz
tion (i.e., probably from the time of bunker con-
transducer was pulled by hand to maintain good
struction; Fig. 9a and 10a). Fill above the excava-
contact between the antenna and the ground sur-
tion surface is characterized by closely spaced
face (Fig. 8b).
9


 Previous Page
