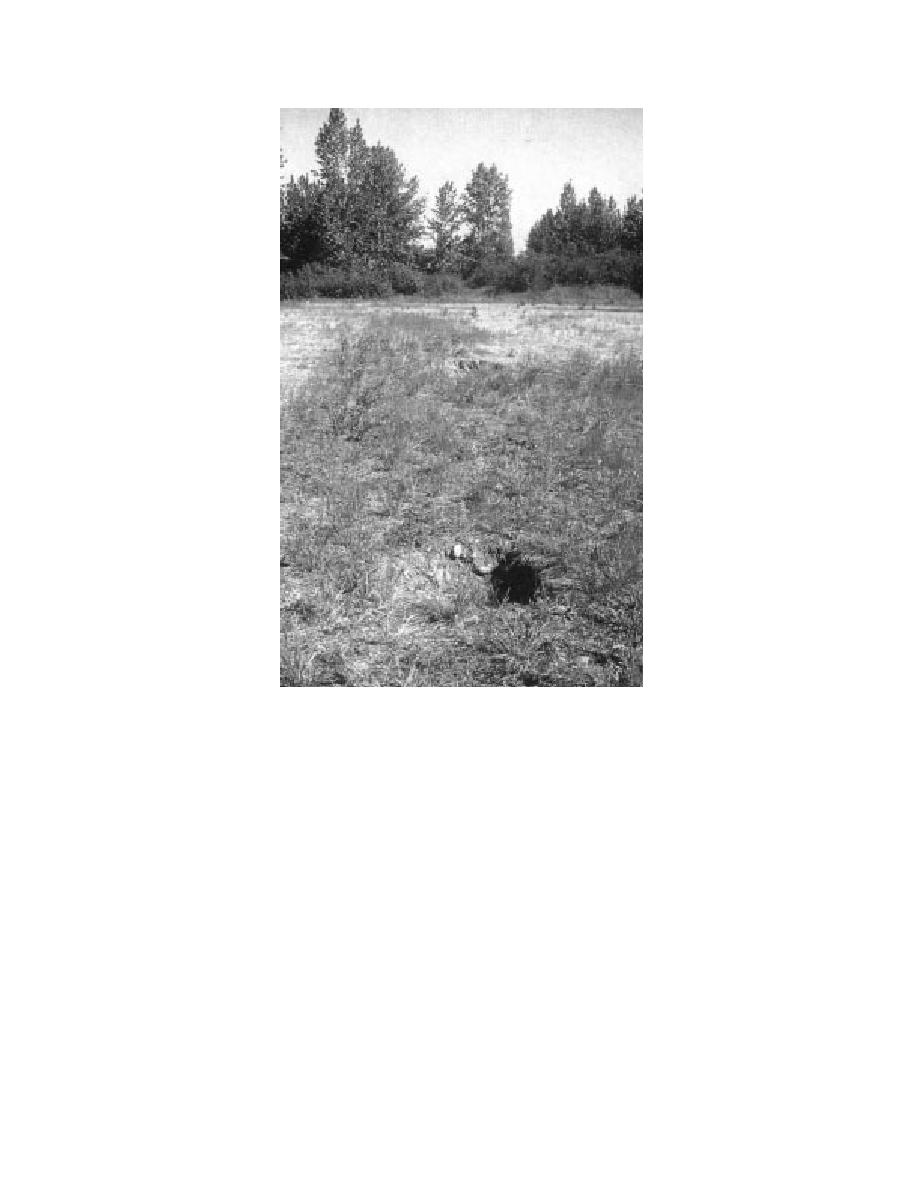
Figure 4. Holes in ground surface caused by collapse of
an underground utilidor.
can be displayed using an operator-selected time-
ground surface by hand or behind a 4-wheel drive
range to suppress higher amplitude early returns
vehicle (Fig. 8). The survey speed was approxi-
(especially from the direct transducer coupling).
mately 1 m/s to maintain a close contact with the
This technique allows enhancement of the lower
ground surface and to maximize signal transmis-
amplitude later signals that reflect at layer inter-
sion through the air/ground interface. This speed
faces and material transitions at greater depths.
provided a profile data density of about 16 scans
The technique is well known and is used exten-
for each meter of transducer travel. Profile data
sively for shallow subsurface exploration (Morey
were later filtered to remove noise and horizon-
1974, Delaney et al. 1997).
tally scaled between event markers to compensate
We used 100- and 400-MHz shielded dipole
for uneven towing speed.
pairs of antennas (Fig. 8) that radiate pulses with
GPR events in a profile consist of reflection
20- and 5-ns duration, respectively. Signals from
bands from continuous horizons and discrete hy-
the 400-MHz transducer were recorded at a time
perbolic reflections that originate from individual
range of 50 ns, while deeper horizons were inves-
targets and abrupt material transitions. The depth
tigated using the 100-MHz transducer at a time
to a target is calculated from the time delay to the
range of 300 ns. Antennas were towed along the
apex of each hyperbola when the material permit-
5


 Previous Page
